Fig. 3.
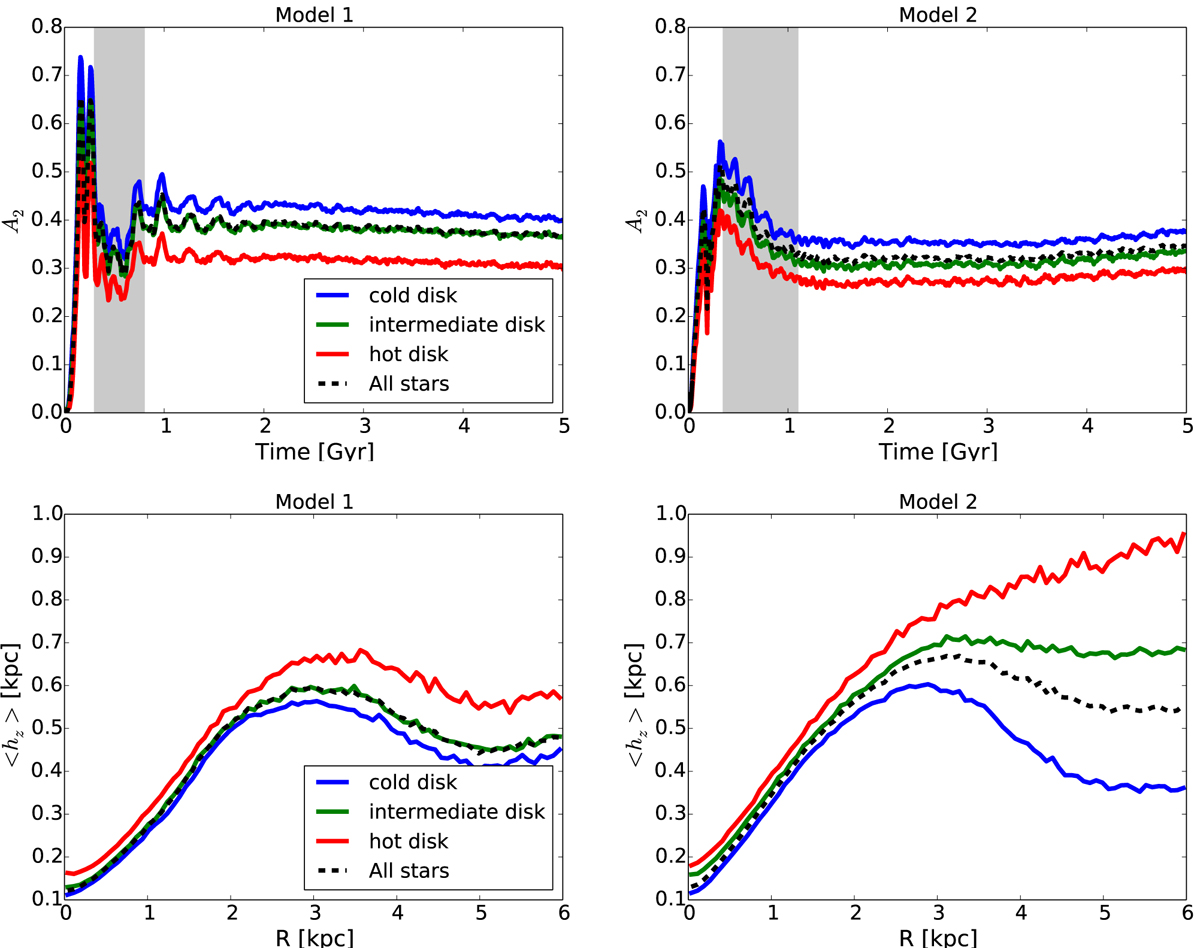
First row: Bar strength A2 as a function of time for all stars (dashed black curve), and for stars initially in the cold (blue curve), intermediate (green curve), and hot (red curve) disks. Second row: Height profiles in the B/P region of all stars, and stars initially in the cold, intermediate, and hot disks. Models 1 and 2 are shown in the left and right columns, respectively. In the panels in the first row, the gray area indicates the time of disk bending. At the end of this instability phase, a B/P-shaped bulge is formed in both models, and its morphology does not change significantly after that time.
Current usage metrics show cumulative count of Article Views (full-text article views including HTML views, PDF and ePub downloads, according to the available data) and Abstracts Views on Vision4Press platform.
Data correspond to usage on the plateform after 2015. The current usage metrics is available 48-96 hours after online publication and is updated daily on week days.
Initial download of the metrics may take a while.