Fig. D.1.
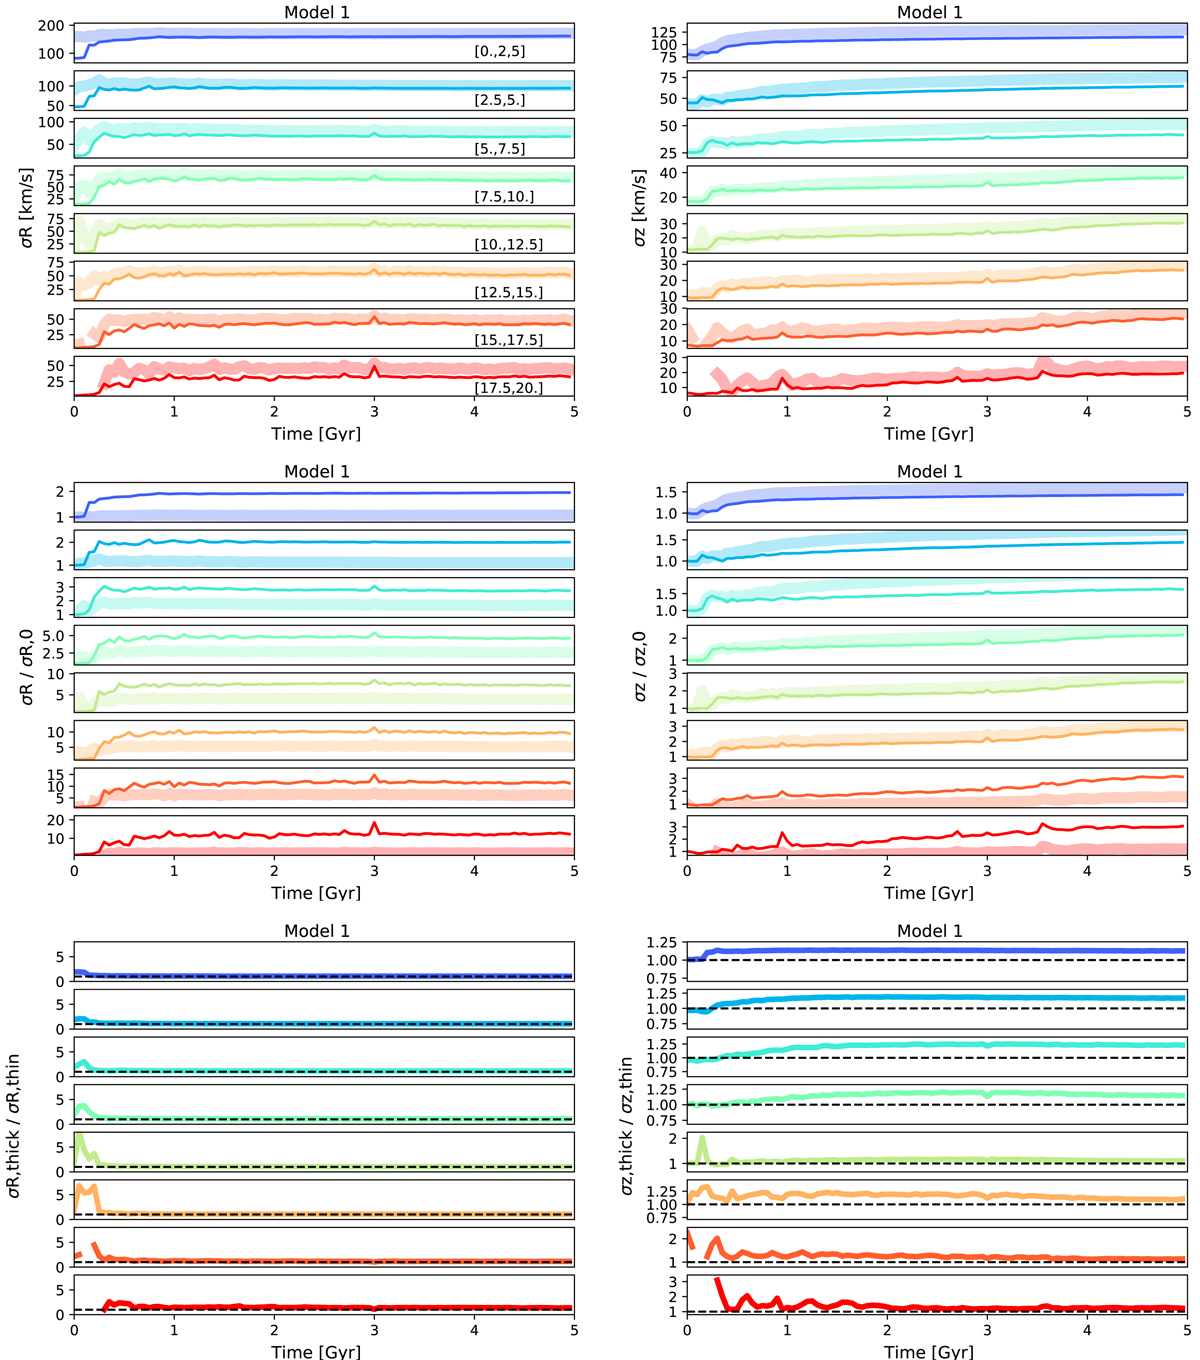
Top and middle rows: Radial (left panels) and vertical (right panels) velocity dispersions as a function of time for stars initially in the cold (thin curves) and hot (thick curves) disks of Model 1. Velocity dispersions are shown for eight different radial annuli in the modeled disk, as indicated in the top left panel, which are also represented by different colors. In the middle panels, velocity dispersions are normalized to their corresponding value at the initial time of the simulation. Bottom row: Ratio of the radial (left panel) and vertical (right panel) velocity dispersions of stars in the initially hot and cold disks for the eight different radial annuli as a function of time. The dashed line indicates the ratio equal to unity.
Current usage metrics show cumulative count of Article Views (full-text article views including HTML views, PDF and ePub downloads, according to the available data) and Abstracts Views on Vision4Press platform.
Data correspond to usage on the plateform after 2015. The current usage metrics is available 48-96 hours after online publication and is updated daily on week days.
Initial download of the metrics may take a while.