Fig. C.1.
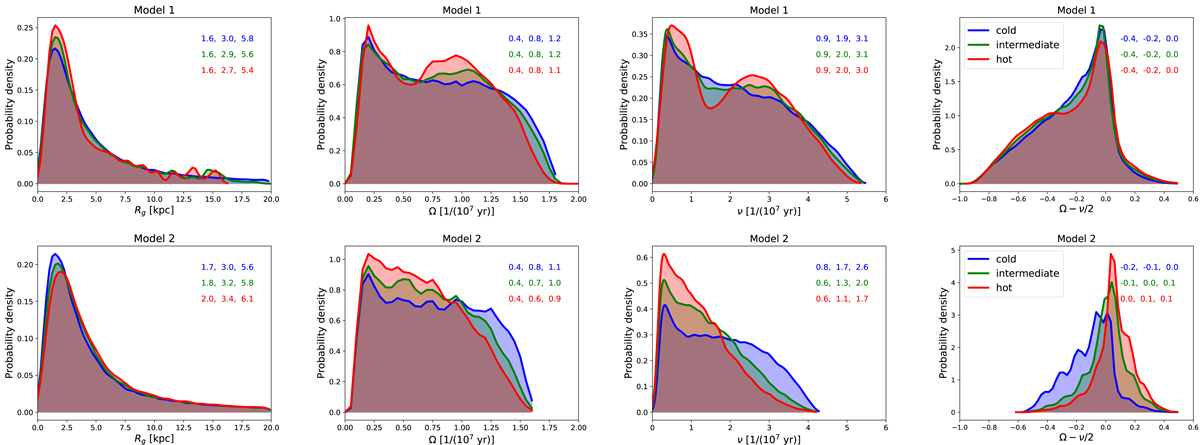
From left to right: Distribution of guiding radii, azimuthal frequencies Ω, vertical frequencies ν, and of the differences Ω − ν/2 for Model 1 (top panels) and Model 2 (bottom panels) at t = 0. In each plot, the blue, green, and red curves correspond to the cold-, intermediate-, and hot-disk components, as indicated. In each plot, we also give the 25th, 50th, and 75th percentile of the distributions, with colors corresponding to each of these components.
Current usage metrics show cumulative count of Article Views (full-text article views including HTML views, PDF and ePub downloads, according to the available data) and Abstracts Views on Vision4Press platform.
Data correspond to usage on the plateform after 2015. The current usage metrics is available 48-96 hours after online publication and is updated daily on week days.
Initial download of the metrics may take a while.