Fig. B.1.
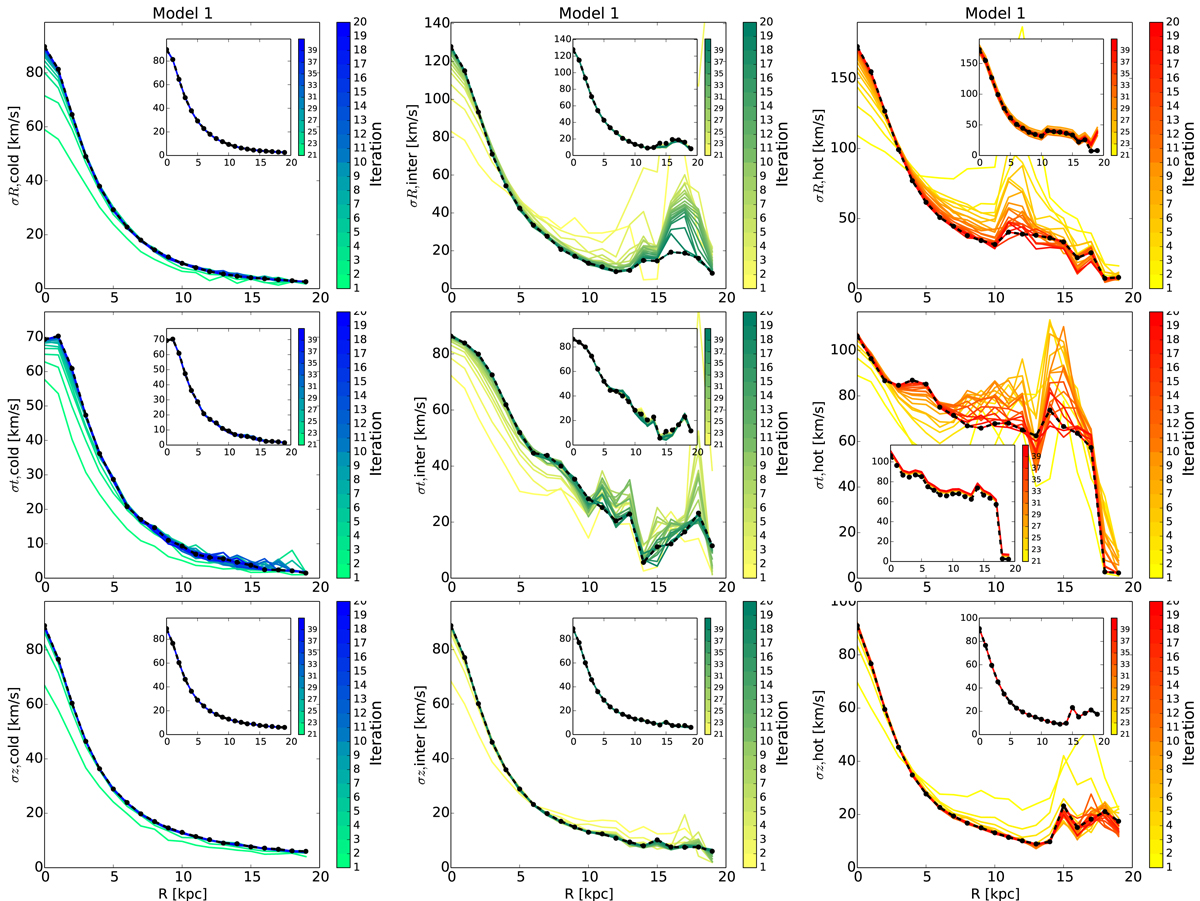
From top to bottom: Evolution of the radial, azimuthal, and vertical velocity dispersion profiles as a function of radius R during the iterative procedure adopted to generate the initial conditions of Model 1. For each plot and each inset in the plot, different colors represent different steps of the iteration, as indicated by the the color bar. In all plots and insets, the black dotted curve indicates the velocity dispersion after 20 iterations, when we consider the system converged to an equilibrium solution. Cold, intermediate, and hot disks are shown in the left, middle, and right columns, as indicated.
Current usage metrics show cumulative count of Article Views (full-text article views including HTML views, PDF and ePub downloads, according to the available data) and Abstracts Views on Vision4Press platform.
Data correspond to usage on the plateform after 2015. The current usage metrics is available 48-96 hours after online publication and is updated daily on week days.
Initial download of the metrics may take a while.