Fig. A.2.
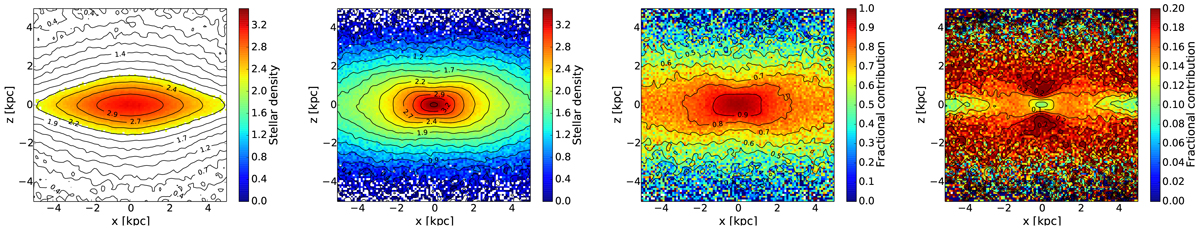
From left to right, first panel: Edge-on stellar density map of particles in the hot disk of Model 2 at t = 0. The density contours trace the whole density distribution of the hot disk in the central regions, the colored map corresponds to the bulge-like part of this distribution (see text for details). Second panel: Edge-on stellar density map at the final time of the simulation of hot-disk particles initially inside the bulge-like region. Third panel: Relative contribution of hot-disk particles initially inside the bulge-like region to the final B/P bulge, as defined by hot-disk particles only. Fourth panel: Relative contribution of hot-disk particles initially inside the bulge-like region to the final B/P bulge as defined by all disk particles, i.e., cold and intermediate disks also included.
Current usage metrics show cumulative count of Article Views (full-text article views including HTML views, PDF and ePub downloads, according to the available data) and Abstracts Views on Vision4Press platform.
Data correspond to usage on the plateform after 2015. The current usage metrics is available 48-96 hours after online publication and is updated daily on week days.
Initial download of the metrics may take a while.