Fig. 3
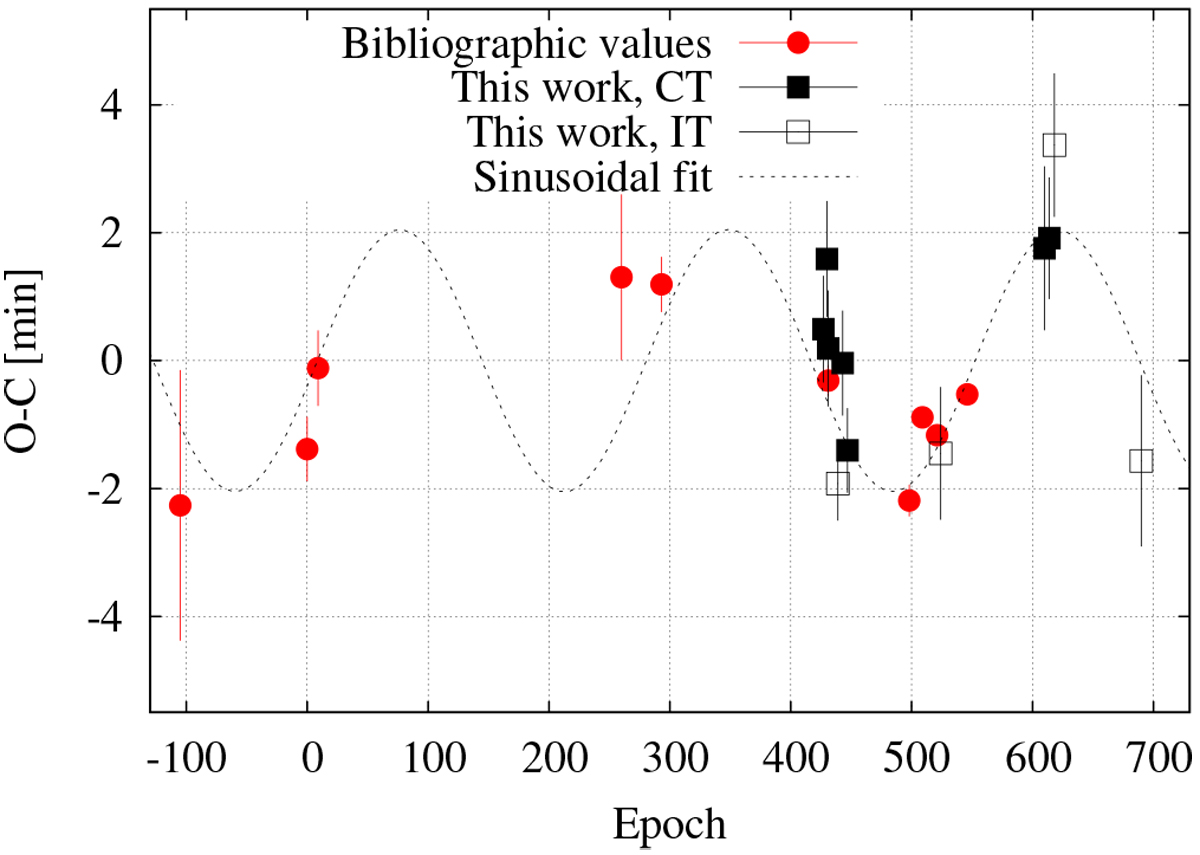
Observed minus calculated (O–C) mid-transit times for HAT-P-26b in minutes. Red circular points show the values obtained from Hartman et al. (2011), Stevenson et al. (2016), and Wakeford et al. (2017). Black filled squares correspond to the values derived in this work considering complete transits, while empty squares are those derived from incomplete transits. The O–C diagram was computed using the best-fit orbital period derived in this work, specified in Table 3. The dashed black line corresponds to our best-fit sinusoidal variability.
Current usage metrics show cumulative count of Article Views (full-text article views including HTML views, PDF and ePub downloads, according to the available data) and Abstracts Views on Vision4Press platform.
Data correspond to usage on the plateform after 2015. The current usage metrics is available 48-96 hours after online publication and is updated daily on week days.
Initial download of the metrics may take a while.