Fig. 2
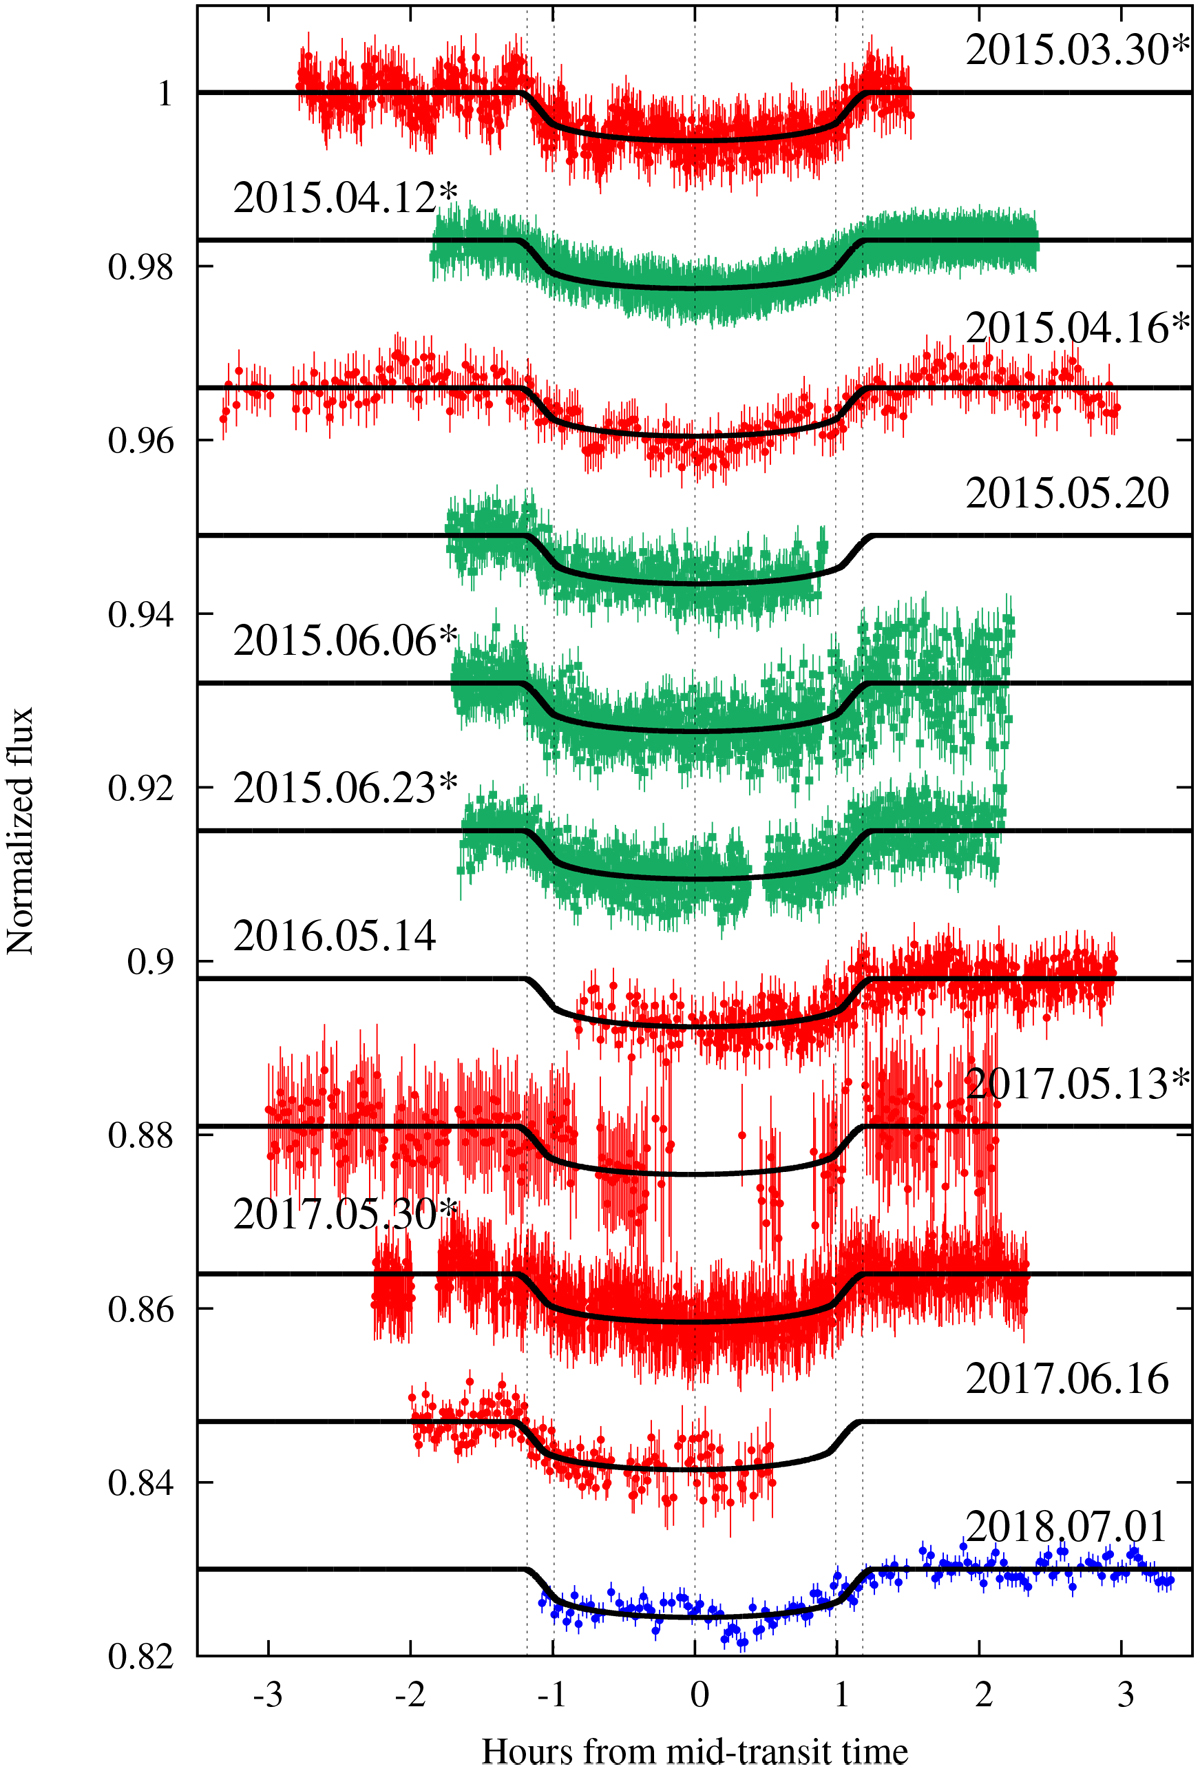
11 transit light curves collected in this work. The transits observed with the Argentinian 2.15 m telescope, CASLEO, are plotted as red circles. The transits taken with the Scandinavian 2.5 m NOT are shown as green squares. The transit observed with STELLA is shown in blue circles. Calender dates are displayed, and asterisks indicate the transits that are complete. Vertical dashed lines indicate the four contact times to guide the reader. Transits have been folded using our best-fit orbital period. In consequence, TTVs can be appreciated by comparing ingress or egress to the vertical dashed lines.
Current usage metrics show cumulative count of Article Views (full-text article views including HTML views, PDF and ePub downloads, according to the available data) and Abstracts Views on Vision4Press platform.
Data correspond to usage on the plateform after 2015. The current usage metrics is available 48-96 hours after online publication and is updated daily on week days.
Initial download of the metrics may take a while.