Fig. 1
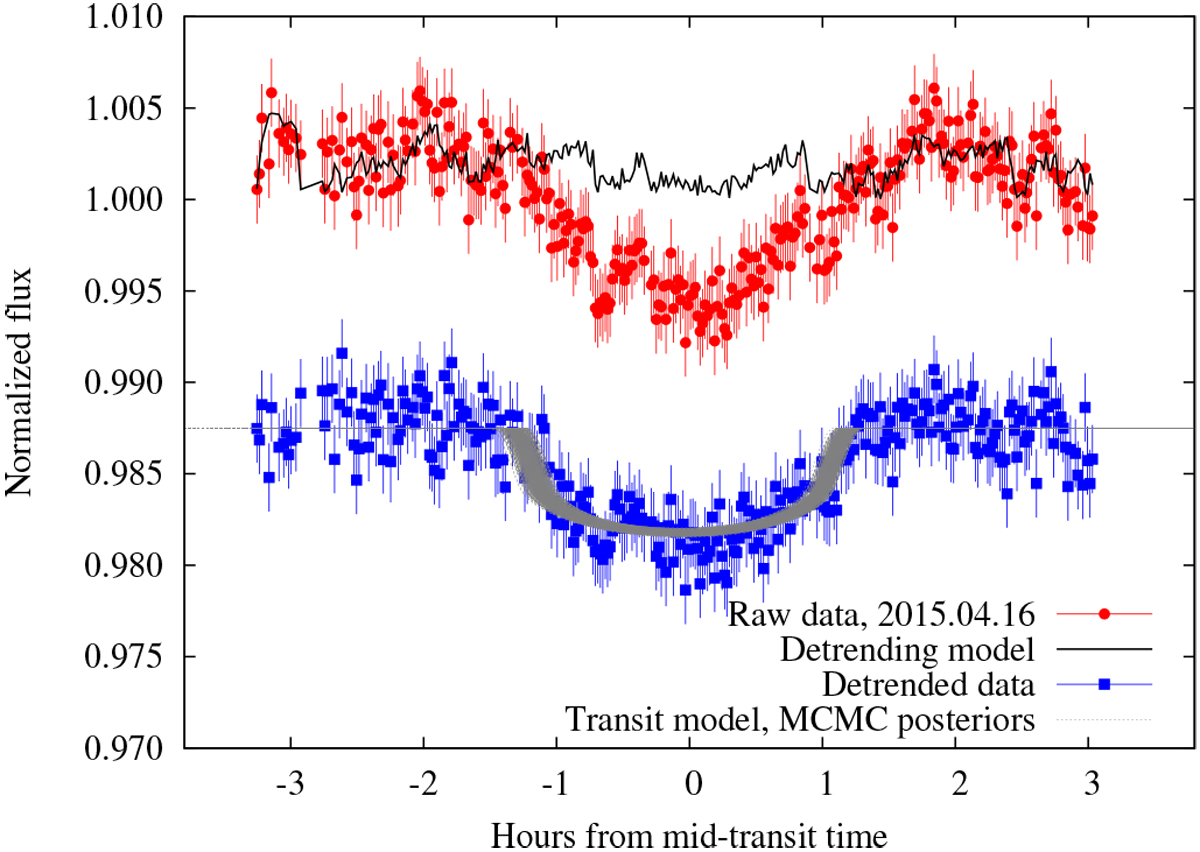
Detrending process. The figure shows the evolution of the transit photometry during the fitting procedure. Raw data are plotted in red circles. The detrending model is plotted as a black continuous line. Artificially shifted, the detrended data are plotted as blue squares, along with primary transit models whose transit parameters are determined by the posterior distributions of the MCMC chains.
Current usage metrics show cumulative count of Article Views (full-text article views including HTML views, PDF and ePub downloads, according to the available data) and Abstracts Views on Vision4Press platform.
Data correspond to usage on the plateform after 2015. The current usage metrics is available 48-96 hours after online publication and is updated daily on week days.
Initial download of the metrics may take a while.