Fig. D.1.
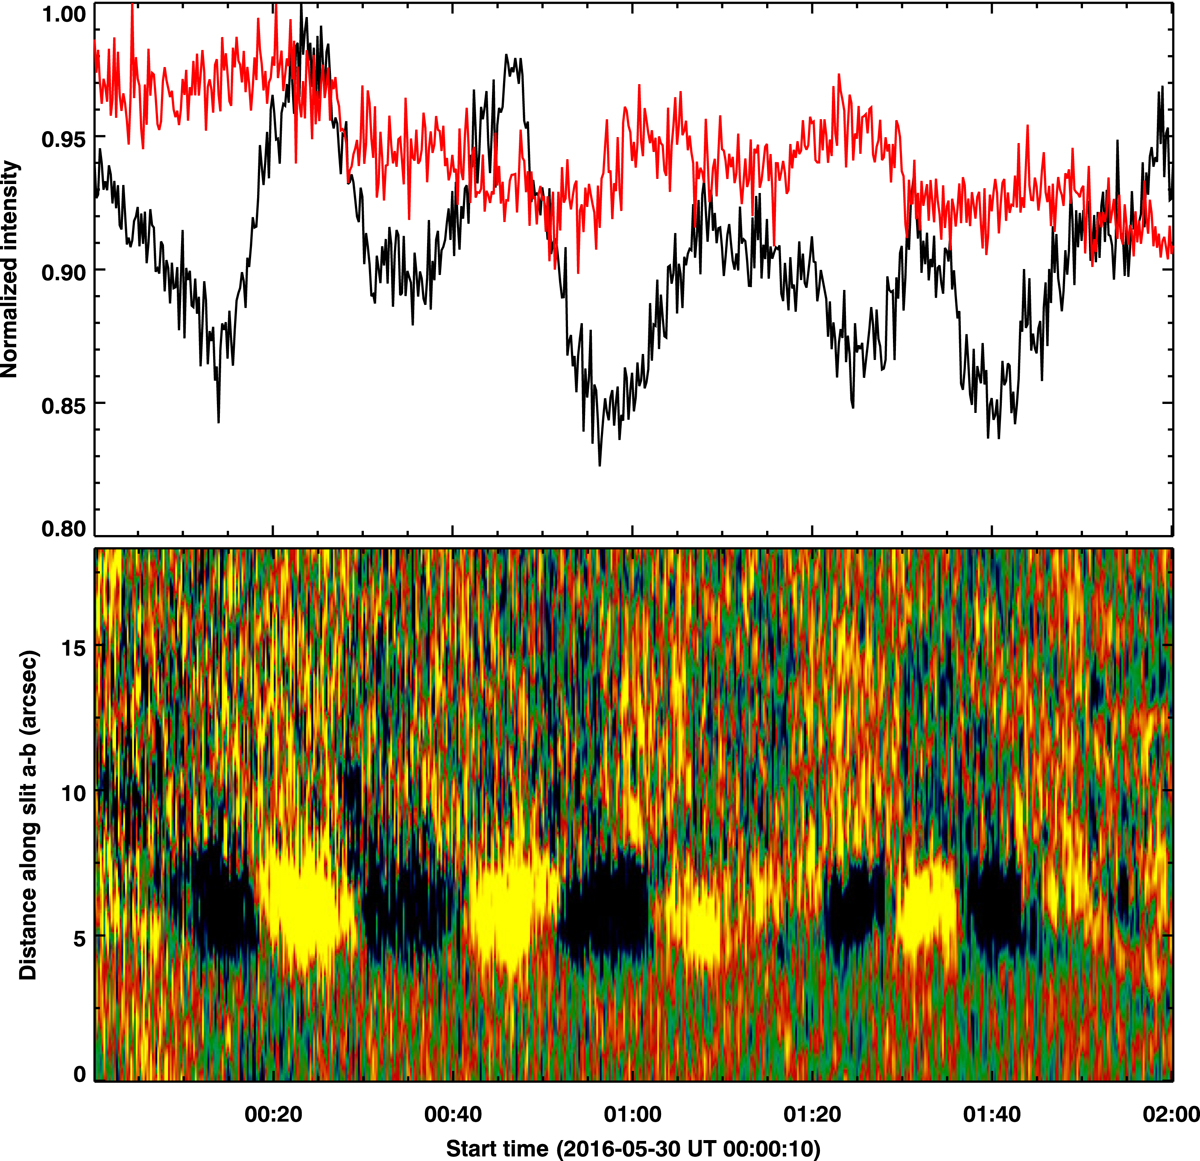
Long-term evolution of the prominence spicules that exhibit quasi-periodic propagating intensity disturbances in a diffused prominence. Plotted for the observations obtained on 2016 May 30 (see Fig. A.1a). Top panel: AIA 171 Å light curves averaged along the sections of the same colored slits as in Fig. A.1a. Bottom panel: space-time map displaying propagating disturbances along slit a–b. See Appendices B.2 and D.
Current usage metrics show cumulative count of Article Views (full-text article views including HTML views, PDF and ePub downloads, according to the available data) and Abstracts Views on Vision4Press platform.
Data correspond to usage on the plateform after 2015. The current usage metrics is available 48-96 hours after online publication and is updated daily on week days.
Initial download of the metrics may take a while.