Fig. C.1.
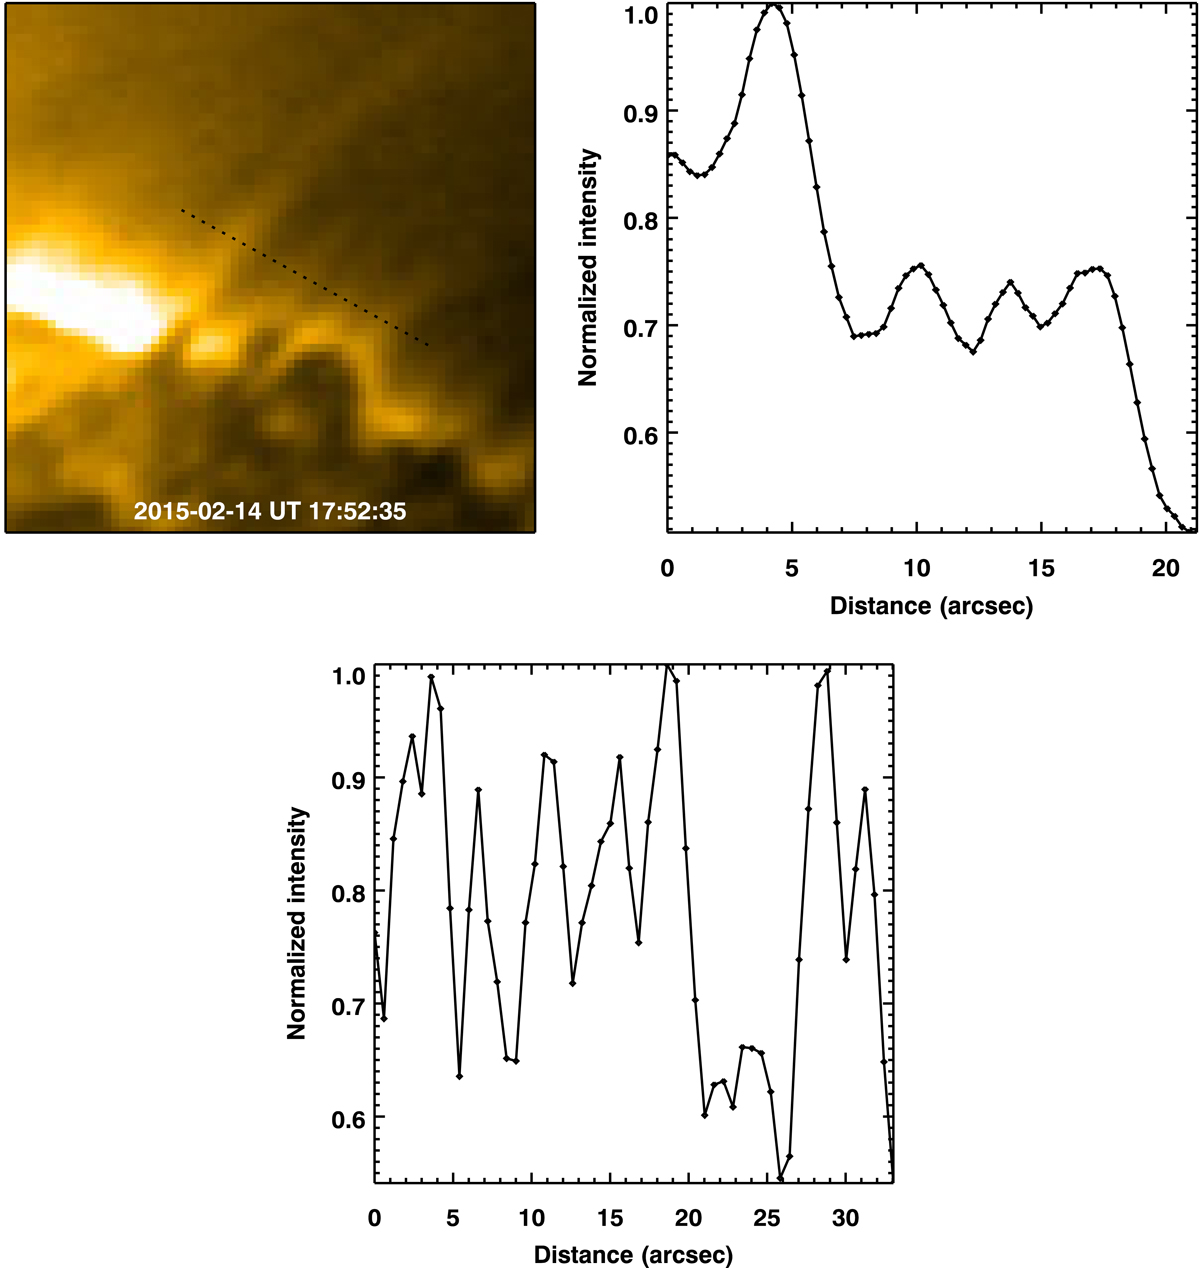
Spatial structuring of prominence spicules. Top left panel: same as the bottom left panel in Fig. 1b. The black dotted line crosses a few structures at that instance. Top right panel: we plot the AIA 171 Å intensity along the dotted line from the top left panel. Bottom panel: AIA 171 Å RMS intensity along the dotted line that is displayed in the top panel of Fig. 1d. See Appendix C for discussion.
Current usage metrics show cumulative count of Article Views (full-text article views including HTML views, PDF and ePub downloads, according to the available data) and Abstracts Views on Vision4Press platform.
Data correspond to usage on the plateform after 2015. The current usage metrics is available 48-96 hours after online publication and is updated daily on week days.
Initial download of the metrics may take a while.