Fig. A.1.
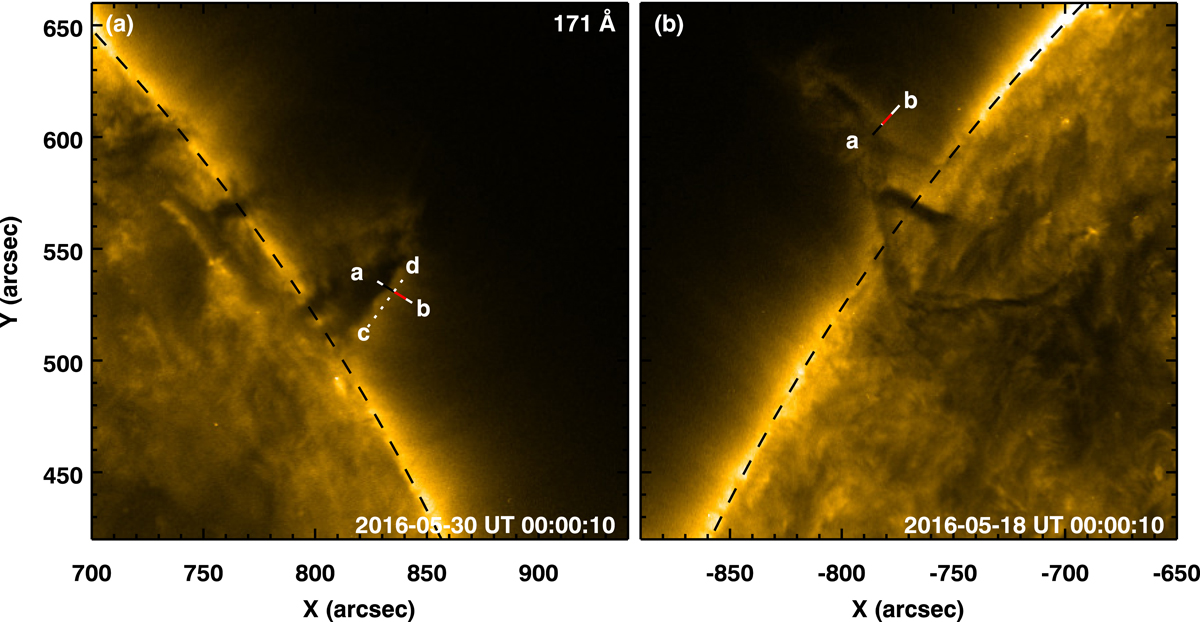
Imaging observations of a prominence-corona system 12 days apart. Same as Fig. 1a, but plotted for the observations obtained on 2016 May 30 (panel a) and 2016 May 18 (panel b). Slits a–b (in both panels) are used to construct the respective space-time displayed in the lower panels of Figs. D.1 and D.2. The black and red marked regions along each slit are used to construct the average AIA 171 Å emission that is plotted as the same color-coded light curves as in the top panels of Figs. D.1 and D.2. Slit c–d in panel a is used to plot wave motions in prominence spicules in Fig. D.4. See Appendix A.2.
Current usage metrics show cumulative count of Article Views (full-text article views including HTML views, PDF and ePub downloads, according to the available data) and Abstracts Views on Vision4Press platform.
Data correspond to usage on the plateform after 2015. The current usage metrics is available 48-96 hours after online publication and is updated daily on week days.
Initial download of the metrics may take a while.