Open Access
Fig. 5.
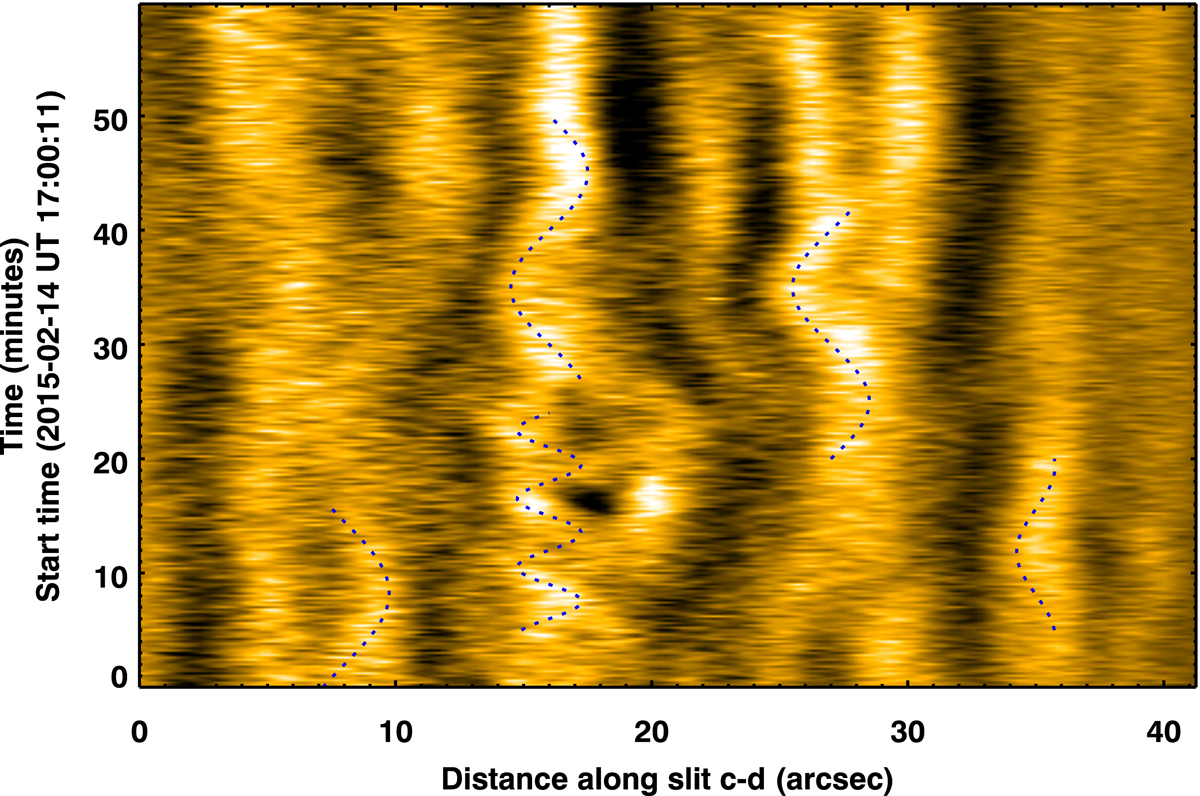
Transverse oscillations exhibited by prominence spicules. The smooth-subtracted image shows the sporadic transverse Alfvénic waves exhibited by prominence spicules, crossing slit c–d in Fig. 1b. The dotted curves are sine waves overlaid on spicule oscillations to guide the eye. See Sect. 2.2 and Appendix B.2 for details.
Current usage metrics show cumulative count of Article Views (full-text article views including HTML views, PDF and ePub downloads, according to the available data) and Abstracts Views on Vision4Press platform.
Data correspond to usage on the plateform after 2015. The current usage metrics is available 48-96 hours after online publication and is updated daily on week days.
Initial download of the metrics may take a while.