Fig. 3.
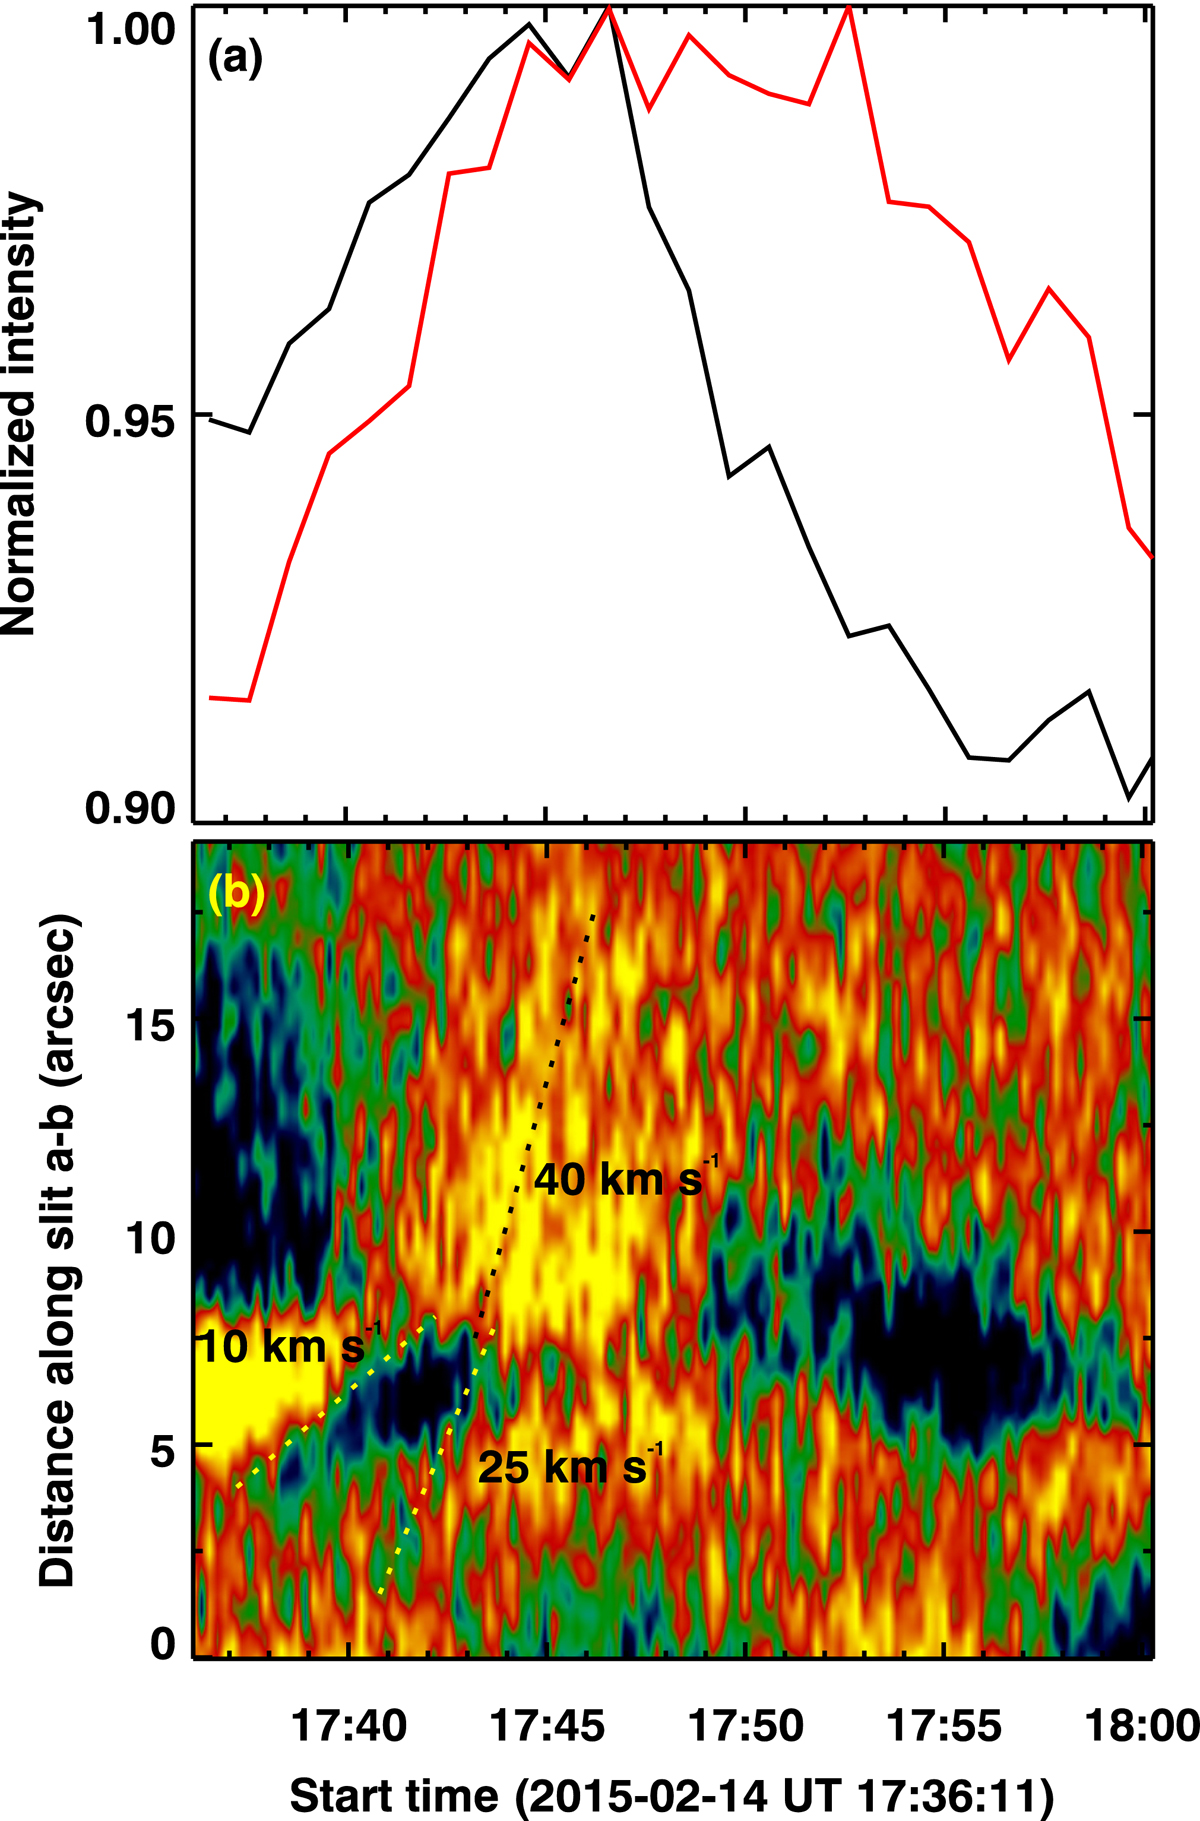
Generation and propagation of a prominence spicule. Panel a: intensity vs. time at two locations along the spicule marked in Fig. 1b. The two light curves are average intensities obtained from the same colored regions as are shown in Fig. 1b. Panel b: space-time map from slit a–b along the spicule shown in Fig. 1b. The slanted dotted lines are for reference to indicate the propagating speeds. See Sect. 2.2 and Appendix B.2 for details.
Current usage metrics show cumulative count of Article Views (full-text article views including HTML views, PDF and ePub downloads, according to the available data) and Abstracts Views on Vision4Press platform.
Data correspond to usage on the plateform after 2015. The current usage metrics is available 48-96 hours after online publication and is updated daily on week days.
Initial download of the metrics may take a while.