Fig. 1.
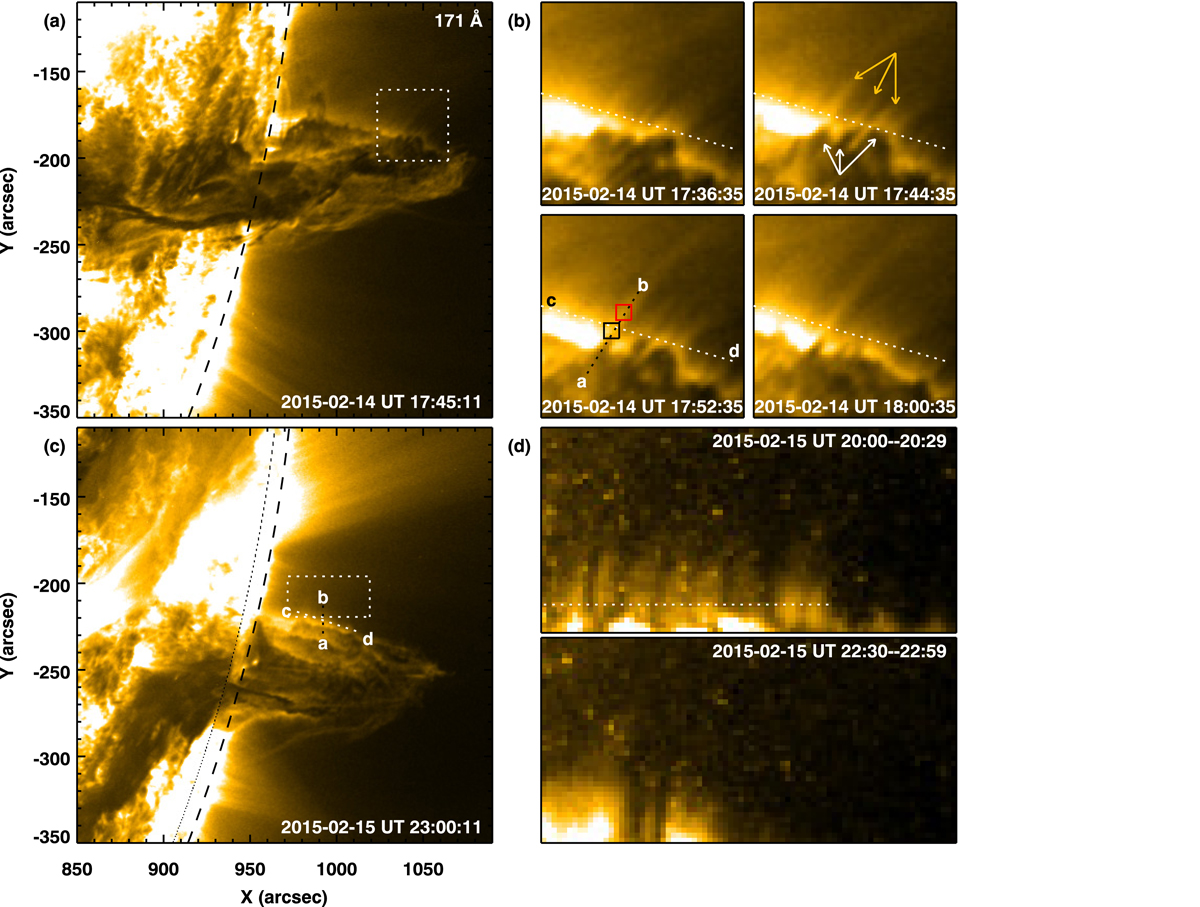
Imaging observations of prominence spicules from a solar prominence. Panel a: coronal EUV emission map recorded by the SDO/AIA 171 Å showing plasma at temperatures of 0.7 MK and more. The map covers a large prominence, seen as an absorption feature, suspended in the corona over the southwest limb of the Sun on 2015-02-14. The dotted box (field of view of 41″ × 41″) identifies a portion of the prominence-corona transition region displayed in panel b. The solar limb is identified with the black dashed curve. Panel b: time sequence of turbulent motions (white upward-pointing arrows) and prominence spicules (yellow downward-pointing arrows) at the prominence-corona transition region. The dynamics along a prominence spicule identified with slit a–b and the two regions (marked with black and red boxes) are shown in Fig. 3. Slit c–d is overlaid as a reference to visualize the out- and inward turbulent motions of the prominence. Wave motions of prominence spicules crossing this slit are shown in Fig. 5. Panel c: same as panel a, but plotted for the observations obtained on 2015 February 15. The dotted box (field of view of 48″ × 24″) identifies a portion of the prominence-corona transition region displayed in panel d (the dotted curve is an artifact created by missing data in these pixels). Slit a–b shows the location through the prominence-corona system that is used to construct the space-time map of propagating intensity disturbances plotted in Fig. 4. Slit c–d is a cut through prominence spicules that is used to plot wave motions in them in Fig. D.3. Panel d: root mean square intensity fluctuations at two different time periods (as noted in the panels) showing prominence spicules emanating from the prominence (see Appendix B.1 for details). The dotted line marks the location from where the RMS intensity is plotted as a function of distance along the slit in Fig. C.1. An animation of panel b is available online (Movie 1). See Sect. 2.1 and Appendices A.1 and B for details.
Current usage metrics show cumulative count of Article Views (full-text article views including HTML views, PDF and ePub downloads, according to the available data) and Abstracts Views on Vision4Press platform.
Data correspond to usage on the plateform after 2015. The current usage metrics is available 48-96 hours after online publication and is updated daily on week days.
Initial download of the metrics may take a while.