Fig. 10.
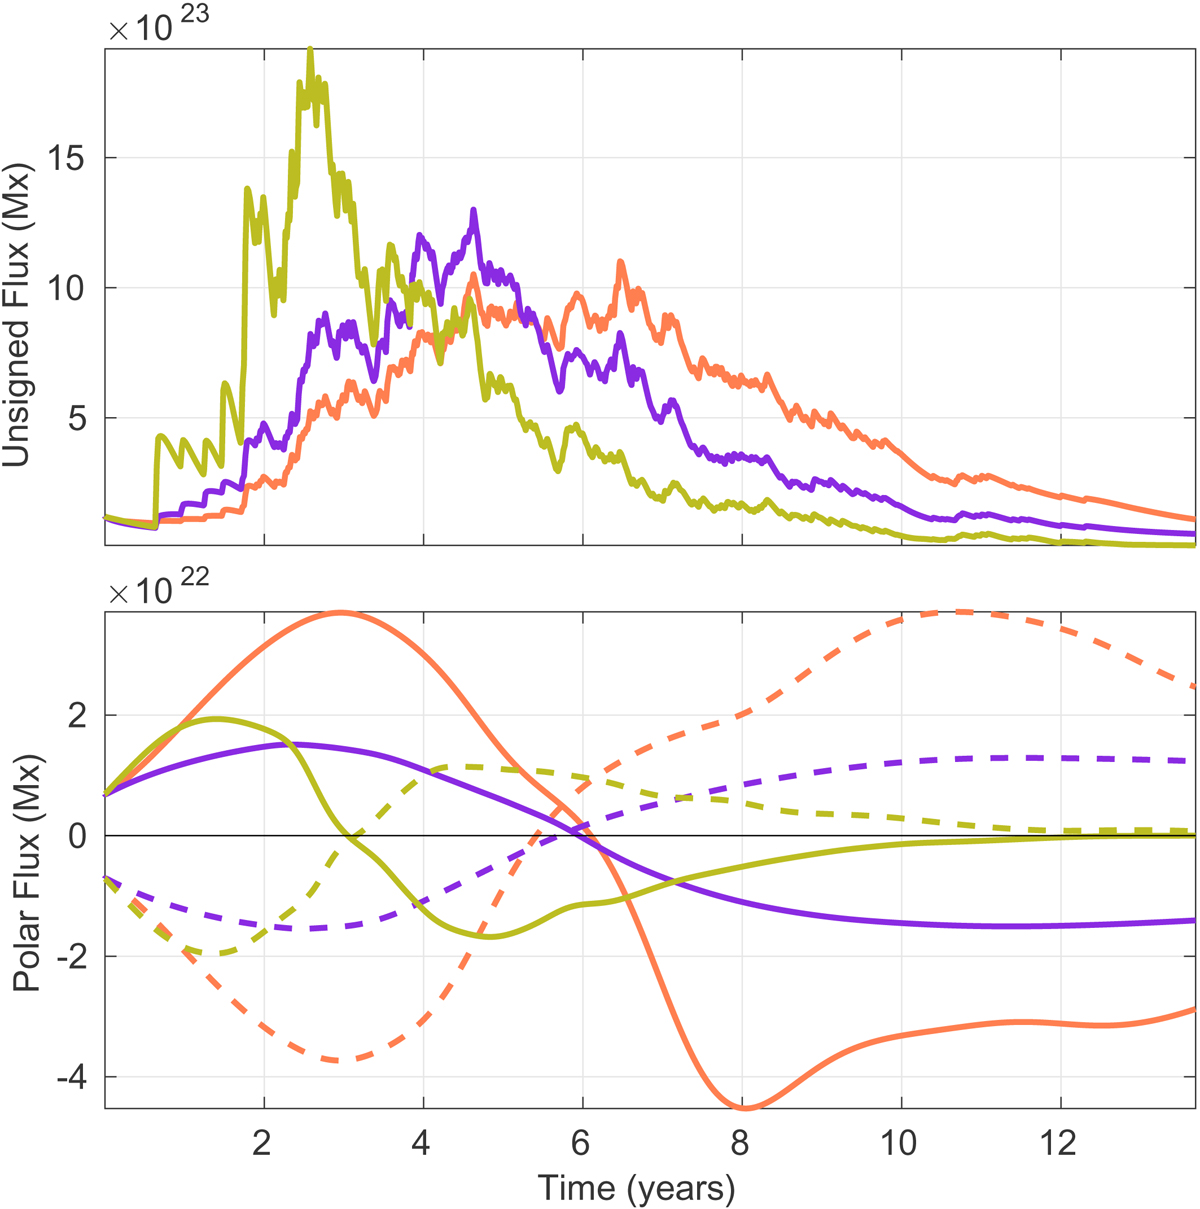
Top: unsigned surface flux from 3D simulations of Cycle 23 using the KD3 diffusion profile (orange), quenching profile (purple) and MLT profile (yellow), but where the initial toroidal field has been strengthened by one and two orders of magnitude for the latter two respectively. Bottom: northern polar flux (solid line) and southern polar flux (dashed line) from the same simulations.
Current usage metrics show cumulative count of Article Views (full-text article views including HTML views, PDF and ePub downloads, according to the available data) and Abstracts Views on Vision4Press platform.
Data correspond to usage on the plateform after 2015. The current usage metrics is available 48-96 hours after online publication and is updated daily on week days.
Initial download of the metrics may take a while.