Fig. 6
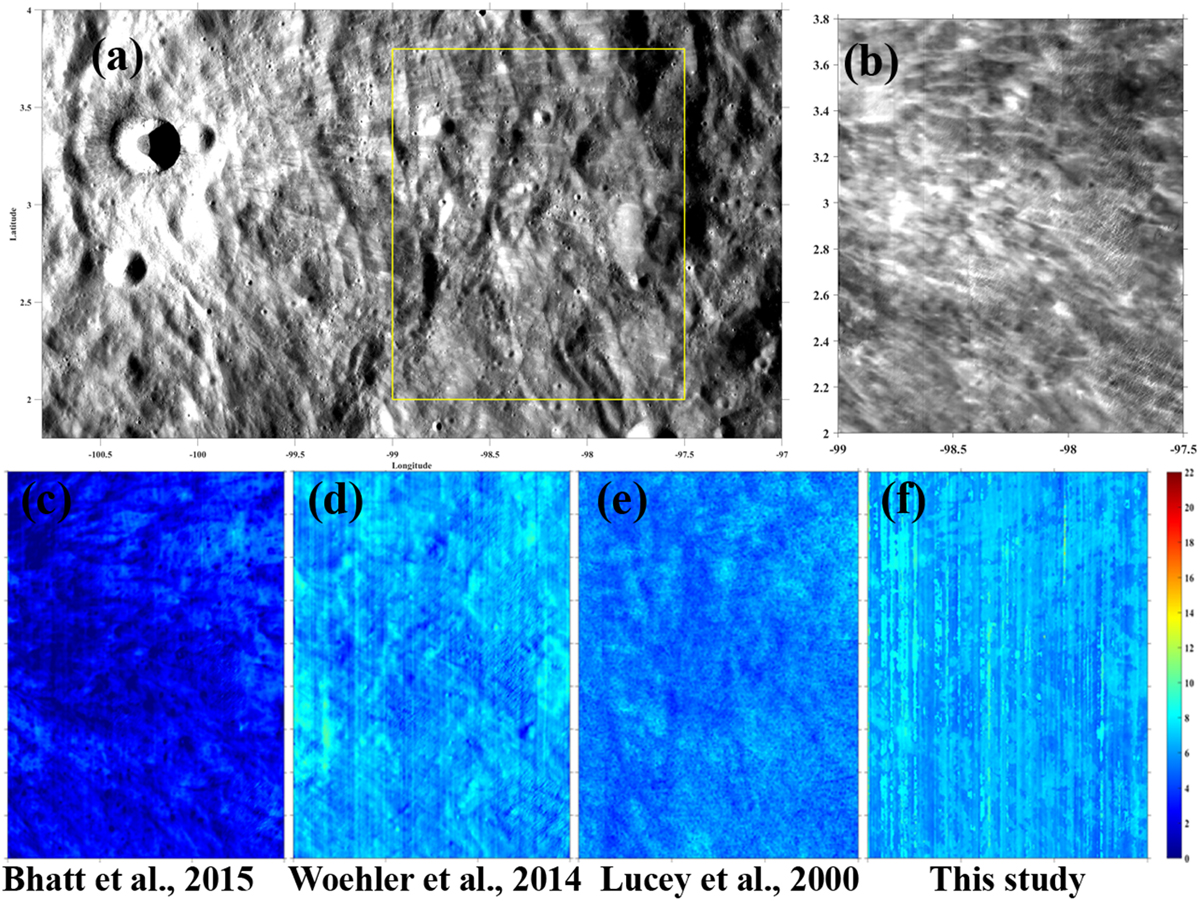
(a) LRO WAC mosaic (Speyerer et al. 2011) of the crater Pierazzo and surroundings. The yellow box outlines the region considered for obtaining the Fe abundances using different approaches. (b) Full resolution M3 mosaic of the region east of the crater Pierazzo. (c)–(f) Fe abundance derived using four different methods. The algorithm of Lucey et al. (2000b) was applied to Clementine UV/VIS data at 100 m/pixel spatial resolution. The prominent ray structures are visible in the Fe abundance maps derived using the algorithms of Bhatt et al. (2015) and Wöhler et al. (2014) but are indistinguishable from the surroundingsurface in the Fe abundance map derived using the proposed MLR approach considering LP GRS as a reference.
Current usage metrics show cumulative count of Article Views (full-text article views including HTML views, PDF and ePub downloads, according to the available data) and Abstracts Views on Vision4Press platform.
Data correspond to usage on the plateform after 2015. The current usage metrics is available 48-96 hours after online publication and is updated daily on week days.
Initial download of the metrics may take a while.