Fig. 5
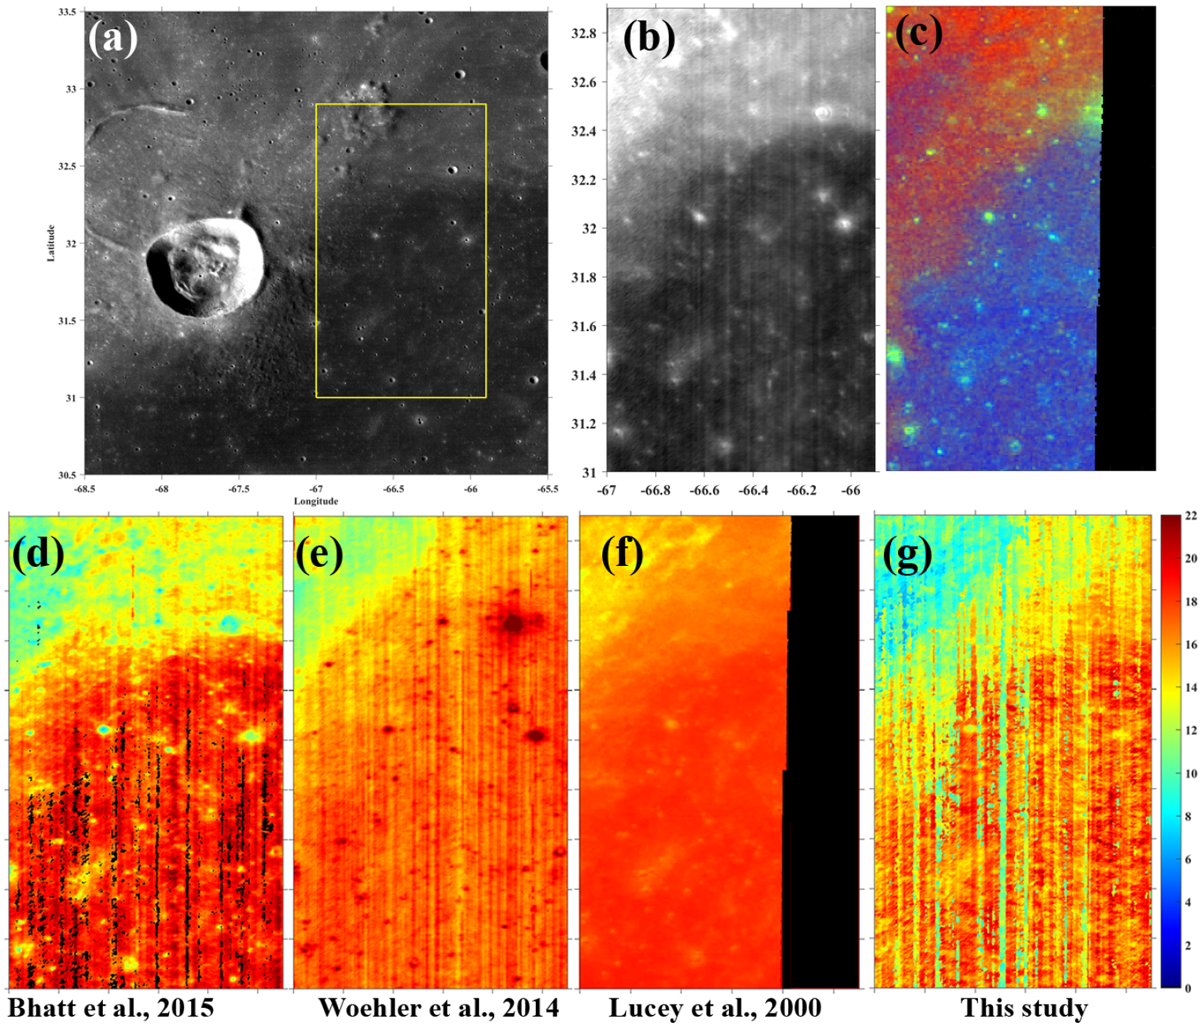
(a) Lunar Reconnaissance Orbiter (LRO) Wide Angle Camera (WAC) mosaic (Speyerer et al. 2011) of the crater Lichtenberg and surroundings. The yellow box outline the region considered for obtaining Fe abundances using different approaches. (b) Full resolution M3 mosaic of the region east of the crater Lichtenberg. (c) Clementine UV/VIS color ratio mosaic (R channel: 750/415 nm, G channel: 750/1000 nm and B channel: 415/750 nm; Pieters et al. 1994) at 200 m/pixel spatial resolution. The low-titanium regions appear in red and yellow and the high-titanium regions appear in blue. (c)–(g) Derived Fe abundance using four different methods. The algorithm of Lucey et al. (2000b) was applied to Clementine UV/VIS data at 100 m/pixel spatial resolution. The dark region is due to a data gap in one of the Clementine bands. The algorithm of Bhatt et al. (2015) estimates a low Fe content for fresh craters, whereas the algorithm of Wöhler et al. (2014) tends to estimate a high Fe content for them. In contrast, small fresh do not appear as small-scale anomalies in the Fe abundance map obtained by the proposed MLR approach considering LP GRS as a reference.
Current usage metrics show cumulative count of Article Views (full-text article views including HTML views, PDF and ePub downloads, according to the available data) and Abstracts Views on Vision4Press platform.
Data correspond to usage on the plateform after 2015. The current usage metrics is available 48-96 hours after online publication and is updated daily on week days.
Initial download of the metrics may take a while.