Fig. 2
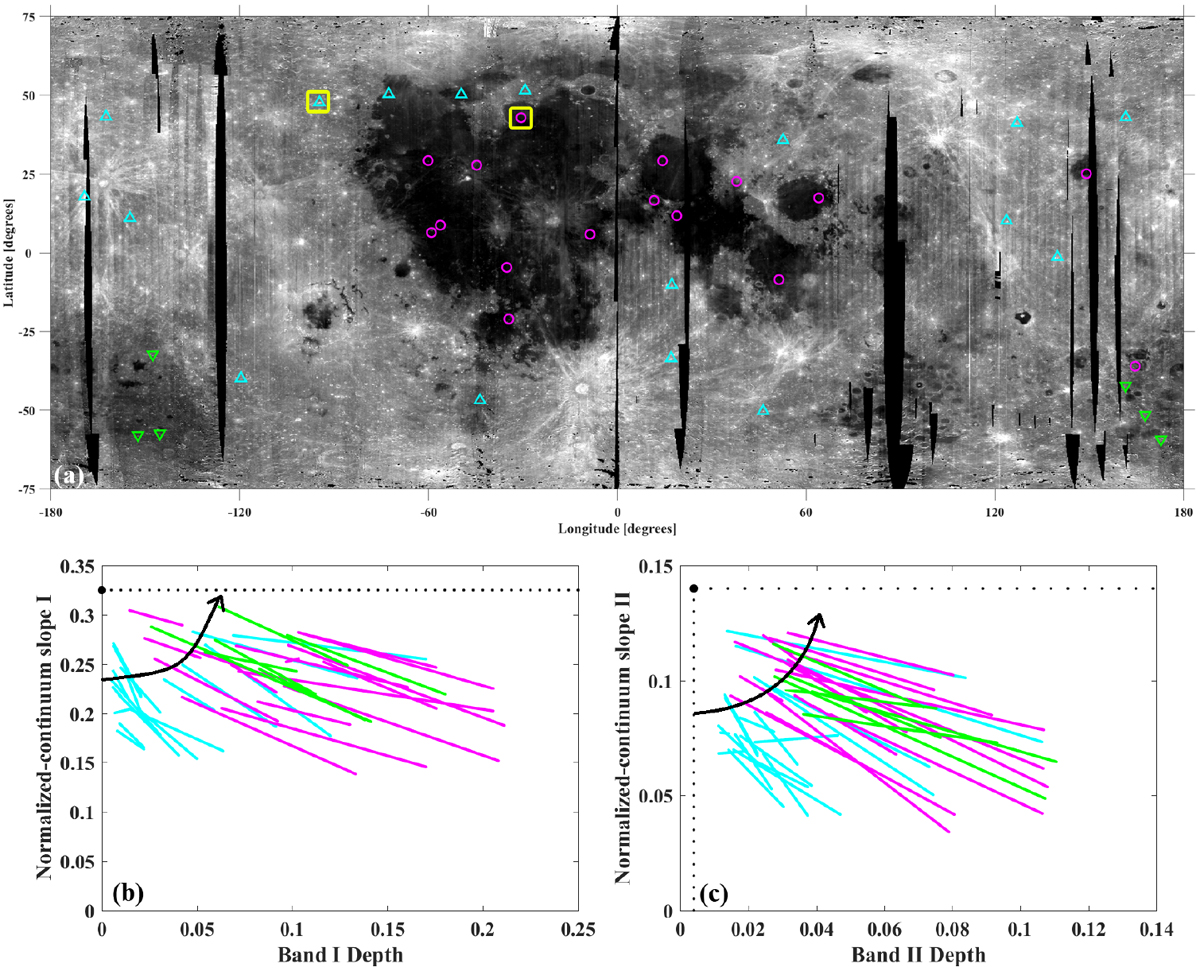
(a) M3 global albedo mosaic (1578 nm) of 20 pixels per degree resolution and location of selected fresh craters. Craters from mare regions are shown in magenta circles and craters from highlands and highland-mare boundaries in cyan triangles. Crater from the South Pole Aitken (SPA) basin are shown as green triangles. The symbols do not represent the actual crater size. The locations marked by yellow squares belong to fresh craters considered for extracting representative spectra in Fig. 1. (b and c) Regression line fit to samples extracted from the locations shown in (a). The best fit regression lines are color coded as in (a) in the normalized continuum slope vs. band depth plots. The continuum slopes of band I and II were normalized to the 0.75 and 1.57 μm reflectances, respectively. Points following a line contain a constant abundance of Fe. The lines are oriented approximately radially with respect to the hypothetical “hypermature” reference point. A larger radial distance from the reference point correspond to fresher material. The definition of the angular parameters is according to Eq. (1) and shown here by an arrow.
Current usage metrics show cumulative count of Article Views (full-text article views including HTML views, PDF and ePub downloads, according to the available data) and Abstracts Views on Vision4Press platform.
Data correspond to usage on the plateform after 2015. The current usage metrics is available 48-96 hours after online publication and is updated daily on week days.
Initial download of the metrics may take a while.