Fig. C.1
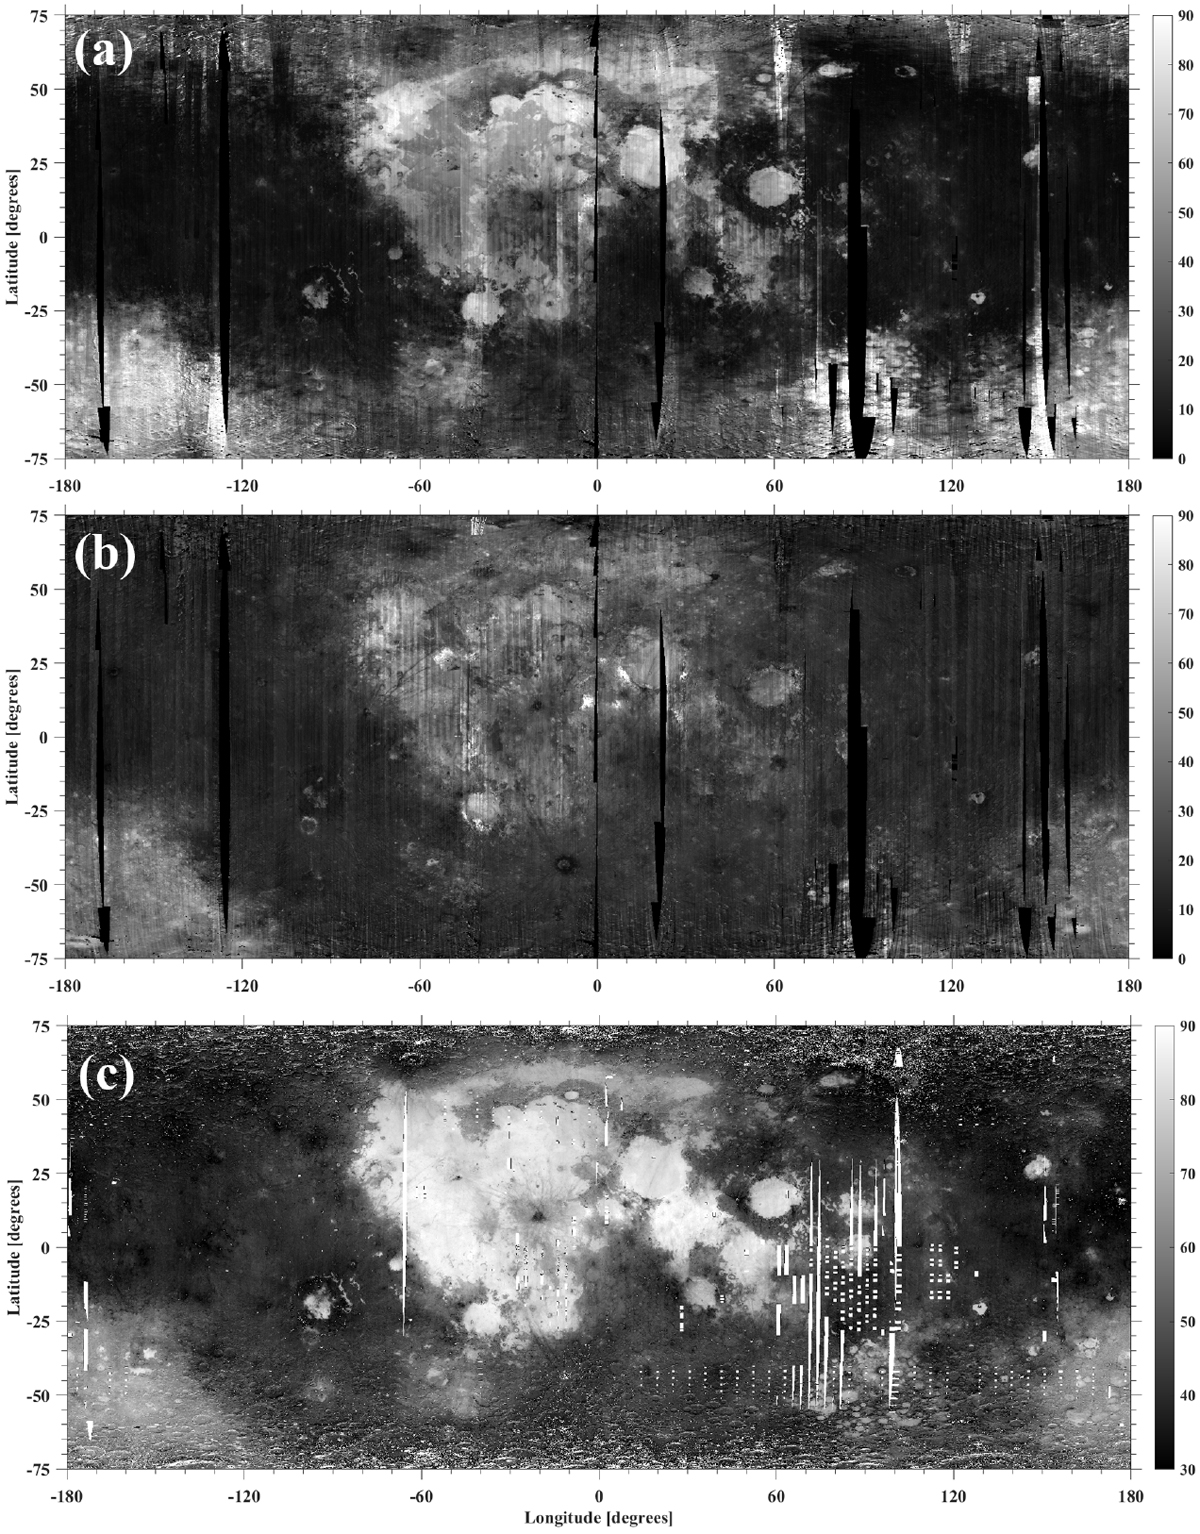
Global maps of iron sensitive parameters derived using Eq. (1) compared with the iron sensitive parameter of Lucey et al. (2000b). The maps have been derived at spatial resolution of 1.5 km at equatorial region. The data gaps are shown in black color in M3 derived iron sensitive parameters and in white color in Clementine derived iron sensitive parameter. (a) A1 parameter; (b) A2 parameter; (c) the angular iron sensitive parameter derived using Eq. (C.1). It should be noted that the iron sensitive parameters derived in this work and from Lucey et al. (2000b) do not belong to the same coordinate space. For comparison purpose we have plotted here − θFe.
Current usage metrics show cumulative count of Article Views (full-text article views including HTML views, PDF and ePub downloads, according to the available data) and Abstracts Views on Vision4Press platform.
Data correspond to usage on the plateform after 2015. The current usage metrics is available 48-96 hours after online publication and is updated daily on week days.
Initial download of the metrics may take a while.