Fig. 1
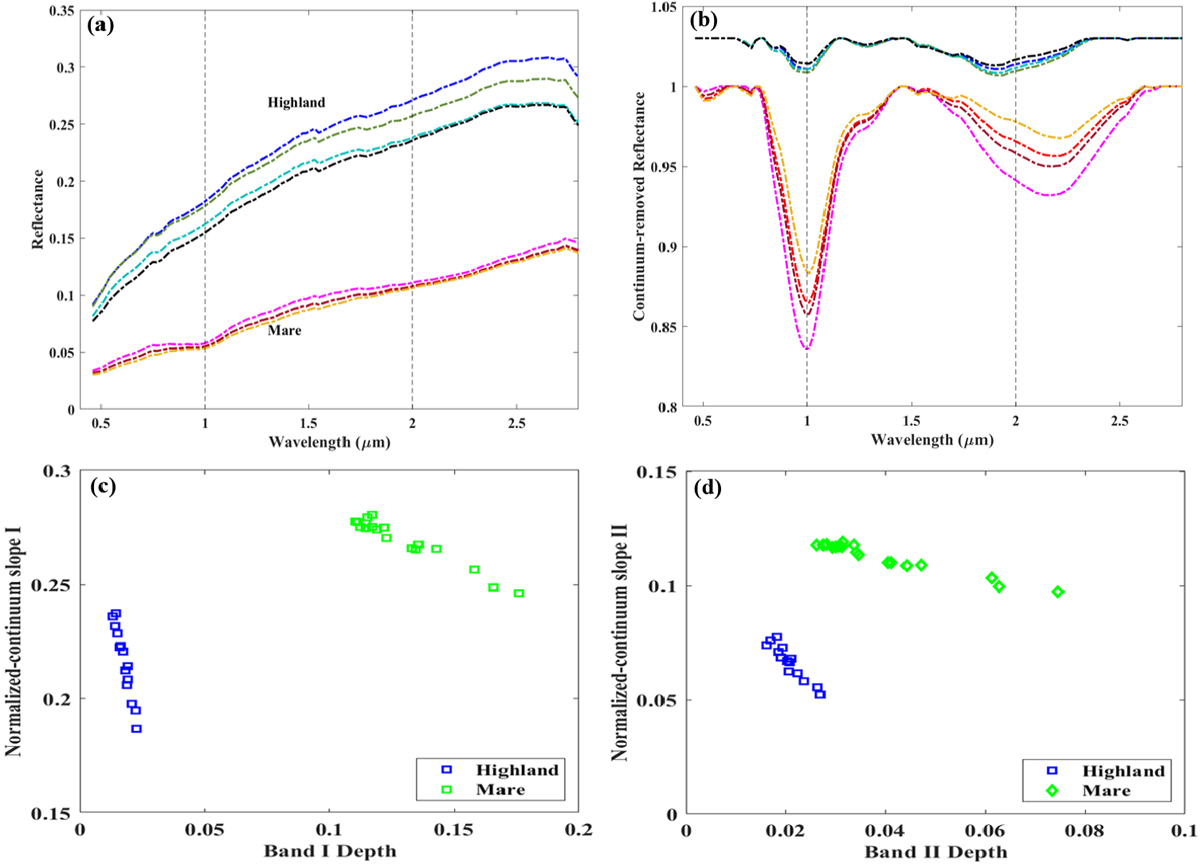
Representative spectra of fresh crater locations from highland and mare regions and their respective band depth vs. continuum slope trends. The fresh crater locations from highland and mare region are marked as yellow squares in Fig. 2. (a) Reflectance spectra extracted from the interior to the outer rim of the ejecta blanket in sequence to demonstrate the decrease in band depth with increasing maturity. (b) Continuum-removed reflectance spectra of (a), clearly showing gradual changes in band depth as we move gradually away from a small crater. The representative spectra of highland in this case are offset by 0.03 for a clear representation. (c, d) Normalized continuum slope vs. band depth plots for band I and band II, respectively, showing linear trends for fresh crater locations from highland and mare regions. Maturity increases towards higher normalized continum slope and lower band depth values. The continuum slopes of band I and band II were normalized to the 0.75 and 1.57 μm reflectances,respectively.
Current usage metrics show cumulative count of Article Views (full-text article views including HTML views, PDF and ePub downloads, according to the available data) and Abstracts Views on Vision4Press platform.
Data correspond to usage on the plateform after 2015. The current usage metrics is available 48-96 hours after online publication and is updated daily on week days.
Initial download of the metrics may take a while.