Fig. 3.
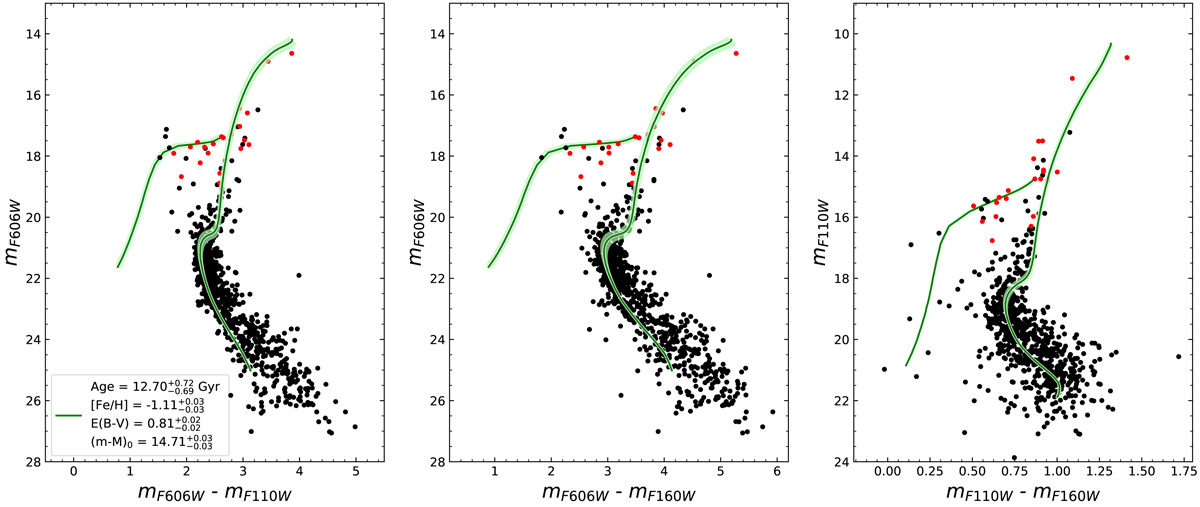
Color–magnitude diagram mF606W vs. mF606W − mF110W (left panel) of ESO 456-SC38 from HST/ACS and WFC3 observations fit with the statistical Bayesian MCMC method (SIRIUS code), based on a grid of BaSTI isochrones. The green solid lines are the most probable solution, and the green region represents the solutions inside 1σ from the posterior distributions. Large red dots are stars identified in Gaia within 25 arcsec of the cluster center. The middle and right panels show the solution computed in the left panel projected over the mF606W vs. mF606W − mF160W (middle) and mF110W vs. mF110W − mF160W (right) CMDs. Stars within 0.15 arcmin of the cluster center are selected.
Current usage metrics show cumulative count of Article Views (full-text article views including HTML views, PDF and ePub downloads, according to the available data) and Abstracts Views on Vision4Press platform.
Data correspond to usage on the plateform after 2015. The current usage metrics is available 48-96 hours after online publication and is updated daily on week days.
Initial download of the metrics may take a while.