Fig. 1
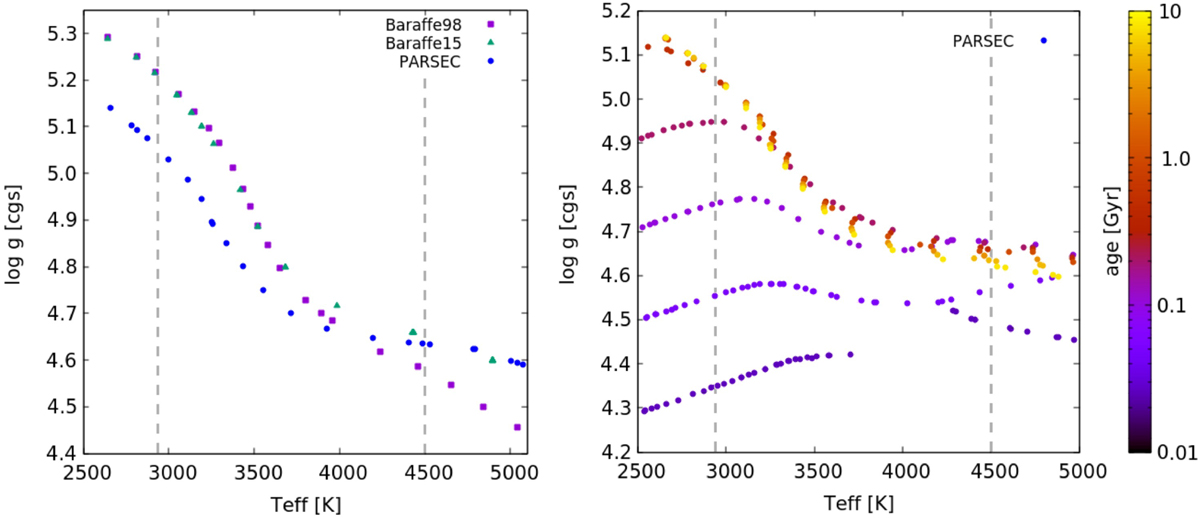
Surface gravity log g as a functionof effective temperature Teff. Left panel: comparison of Lyon group’s BCAH98 (Baraffe et al. 1998), BHAC15 (Baraffe et al. 2015) models, and PARSEC models for [M/H] = 0 and fixed age of 5 Gyr. Right panel: PARSEC models for [M/H] = 0 and variable age from 0.01 to10 Gyr. The gray vertical lines indicate the temperature range of our PHOENIX-SESAM grid from 2900 to 4500 K.
Current usage metrics show cumulative count of Article Views (full-text article views including HTML views, PDF and ePub downloads, according to the available data) and Abstracts Views on Vision4Press platform.
Data correspond to usage on the plateform after 2015. The current usage metrics is available 48-96 hours after online publication and is updated daily on week days.
Initial download of the metrics may take a while.