Fig. 4.
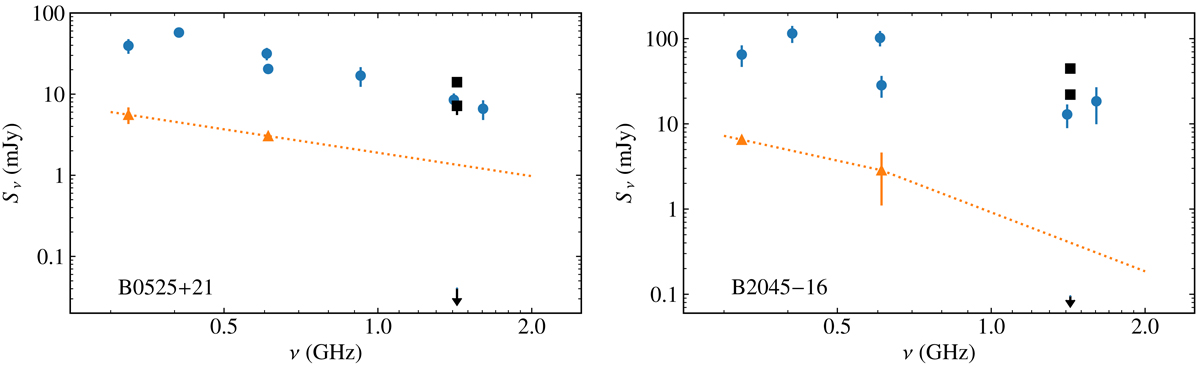
Combined spectra of B0525+21 (left) and B2045−16 (right) for the pulsed and off-pulse emission. The blue circles represent the pulsed emission reported by Basu et al. (2012); Maron et al. (2000), and Lorimer et al. (1995). The orange triangles represent the off-pulse emission reported by Basu et al. (2012). The black squares show the EVN results for the pulsed emission, and the black arrows represent the 3σ upper-limits derived for the off-pulse emission from the EVN data. The dotted orange lines show the extrapolated spectrum for the off-pulse emission derived from Basu et al. (2012) for reference. A spectral break has been included for B2045−16 to show the worst-case scenario; see text for details.
Current usage metrics show cumulative count of Article Views (full-text article views including HTML views, PDF and ePub downloads, according to the available data) and Abstracts Views on Vision4Press platform.
Data correspond to usage on the plateform after 2015. The current usage metrics is available 48-96 hours after online publication and is updated daily on week days.
Initial download of the metrics may take a while.