Fig. 3.
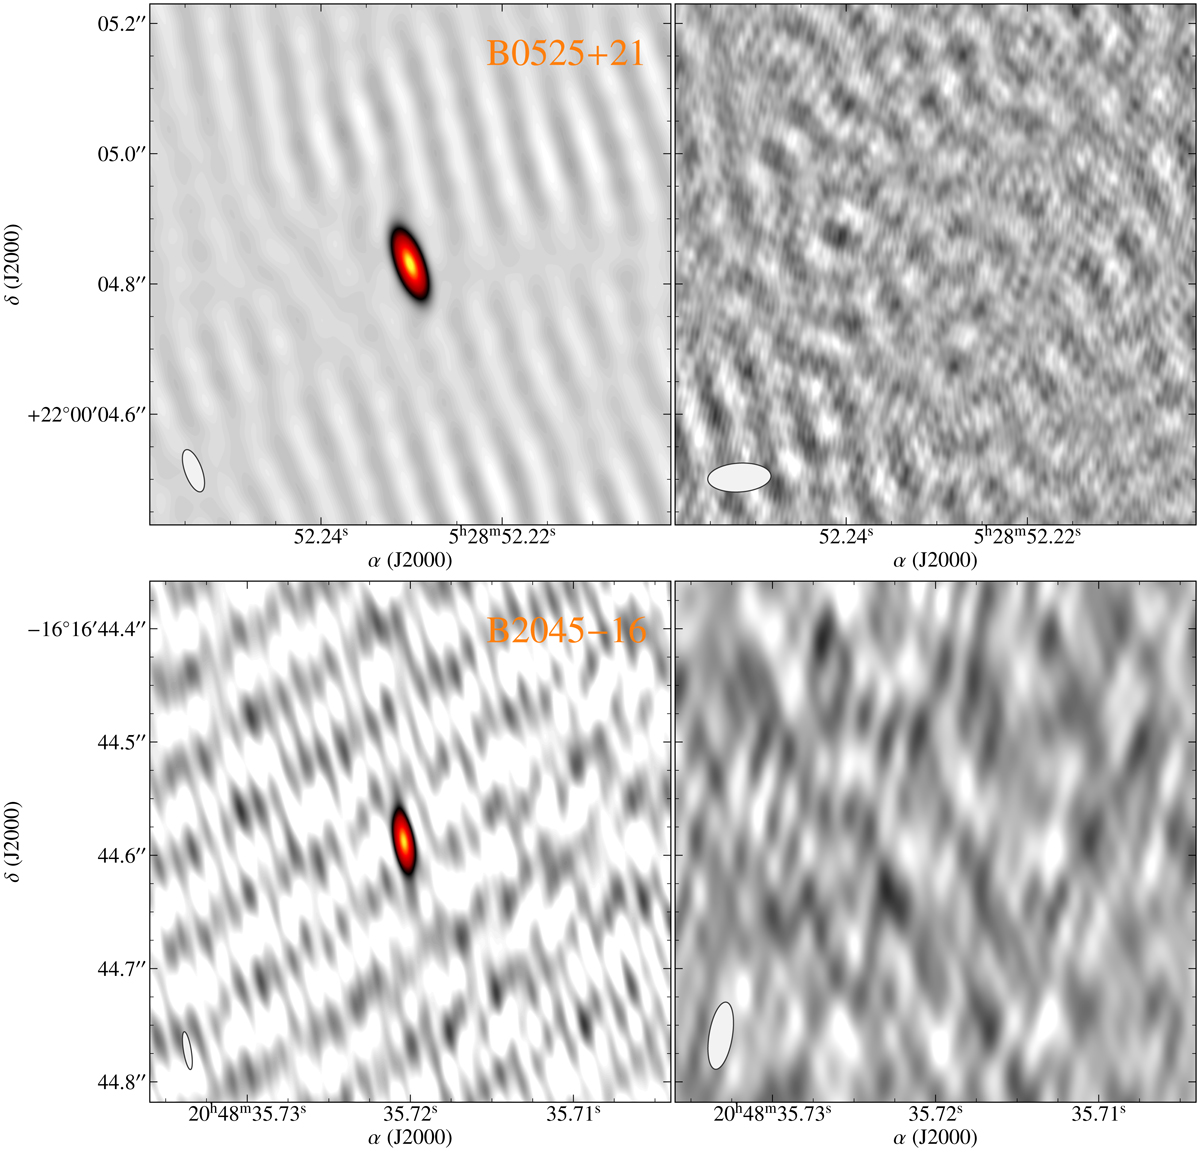
Images from EVN of B0525+21 (top) and B2045−16 (bottom). Left panels: images for the pulsed emission from each pulsar, whereas right panels: for the off-pulse regions (see text for further details). The color scale starts above the 3σ rms noise level of each image, and the grayscale covers the range −3σ to 3σ. Synthesized beams are shown at the bottom left corner of each panel. From left to right and top to bottom: rms noise values for each image are 2 mJy beam−1, 14 μJy beam−1, 3 mJy beam−1, and 32 μJy beam−1. The peak brightnesses of the pulsed emission are 110 and 323 mJy beam−1 for B0525+21 (top left) and B2045−16 (bottom left).
Current usage metrics show cumulative count of Article Views (full-text article views including HTML views, PDF and ePub downloads, according to the available data) and Abstracts Views on Vision4Press platform.
Data correspond to usage on the plateform after 2015. The current usage metrics is available 48-96 hours after online publication and is updated daily on week days.
Initial download of the metrics may take a while.