Fig. 1.
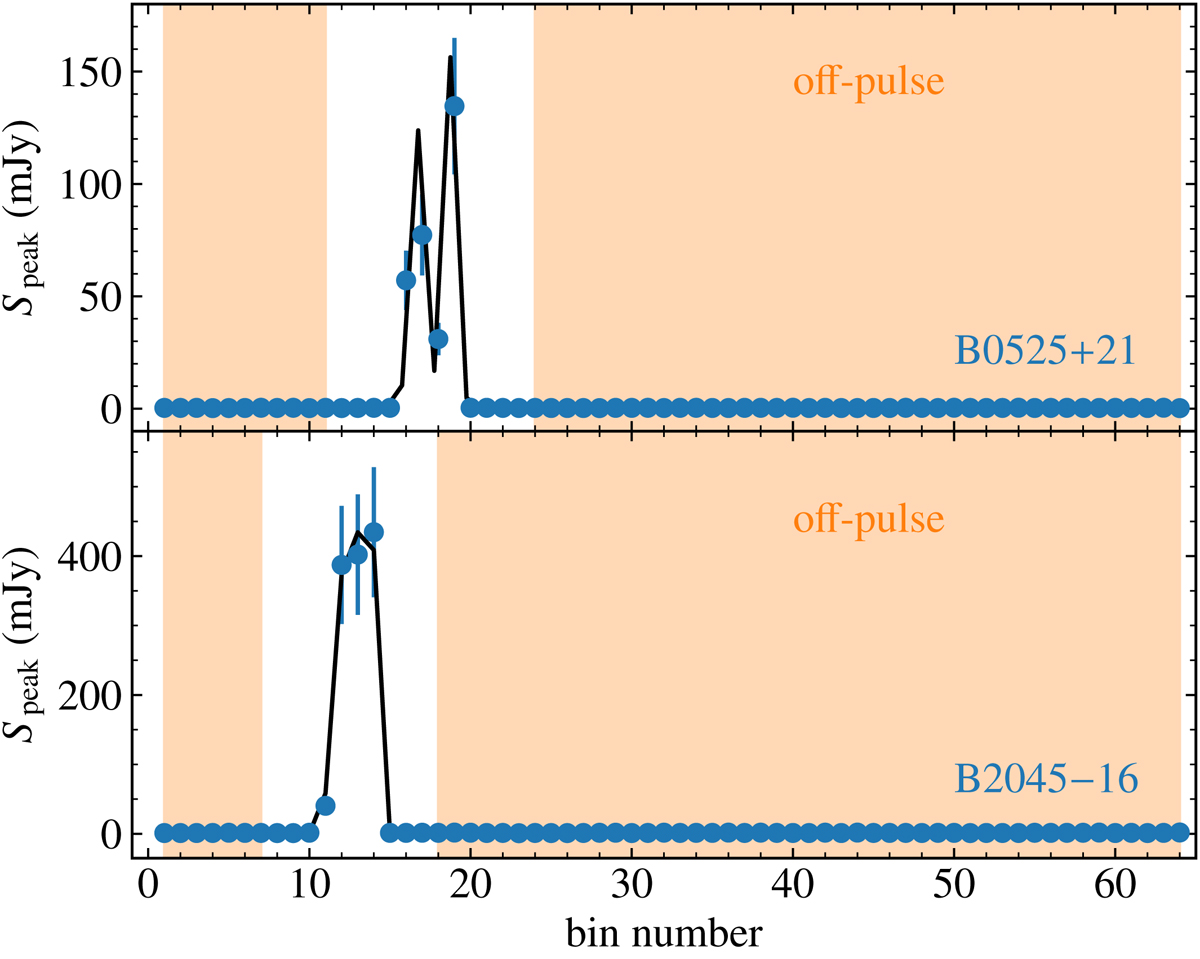
Light curves folded over the rotation periods of B0525+21 (top) and B2045−16 (bottom). Pulsed emission is detected in bins 16–19 and 11–14, respectively. Blue filled circles represent the peak brightness per bin in the dirty map, and their error bars show the 1σ uncertainty on each measurement. The black line represents the pulse profile derived from the Effelsberg PSRIX single-dish data. The uncalibrated profiles from single-dish data are manually aligned (using an arbitrary scale) with the light curves obtained from dirty images, and are presented only to show consistency. The orange regions represent the bins used to search for the off-pulse emission in each pulsar.
Current usage metrics show cumulative count of Article Views (full-text article views including HTML views, PDF and ePub downloads, according to the available data) and Abstracts Views on Vision4Press platform.
Data correspond to usage on the plateform after 2015. The current usage metrics is available 48-96 hours after online publication and is updated daily on week days.
Initial download of the metrics may take a while.