Fig. 8
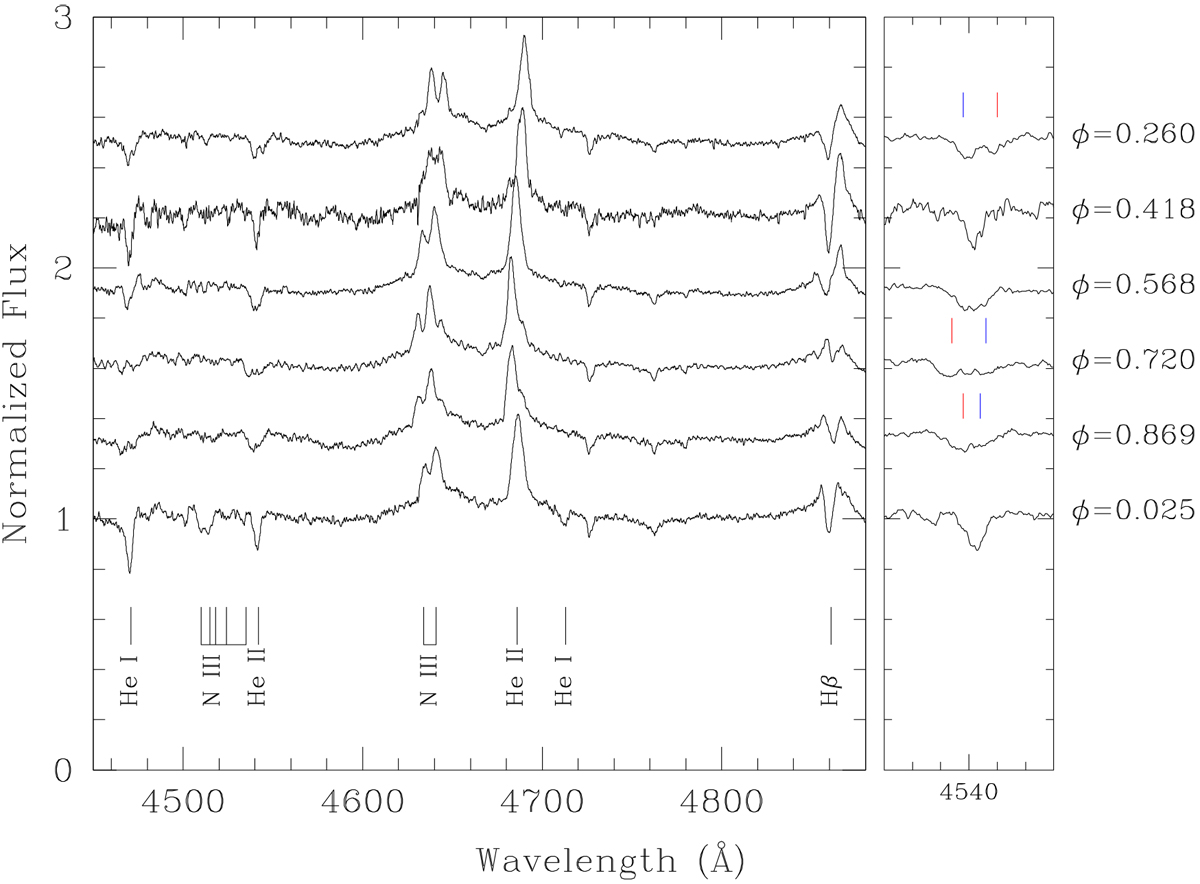
Blue spectrum of Cyg OB2 #5 as a function of orbital phase as observed with the Aurélie spectrograph during our June 2014 OHP campaign. For clarity the consecutive spectra are shifted vertically by 0.3 continuum units. Right panel: zoom on the He II λ 4542 line. The blue and red tick marks above the spectra indicate the position of the primary and secondary absorptions, respectively, for those spectra where the lines were resolved.
Current usage metrics show cumulative count of Article Views (full-text article views including HTML views, PDF and ePub downloads, according to the available data) and Abstracts Views on Vision4Press platform.
Data correspond to usage on the plateform after 2015. The current usage metrics is available 48-96 hours after online publication and is updated daily on week days.
Initial download of the metrics may take a while.