Fig. 7.
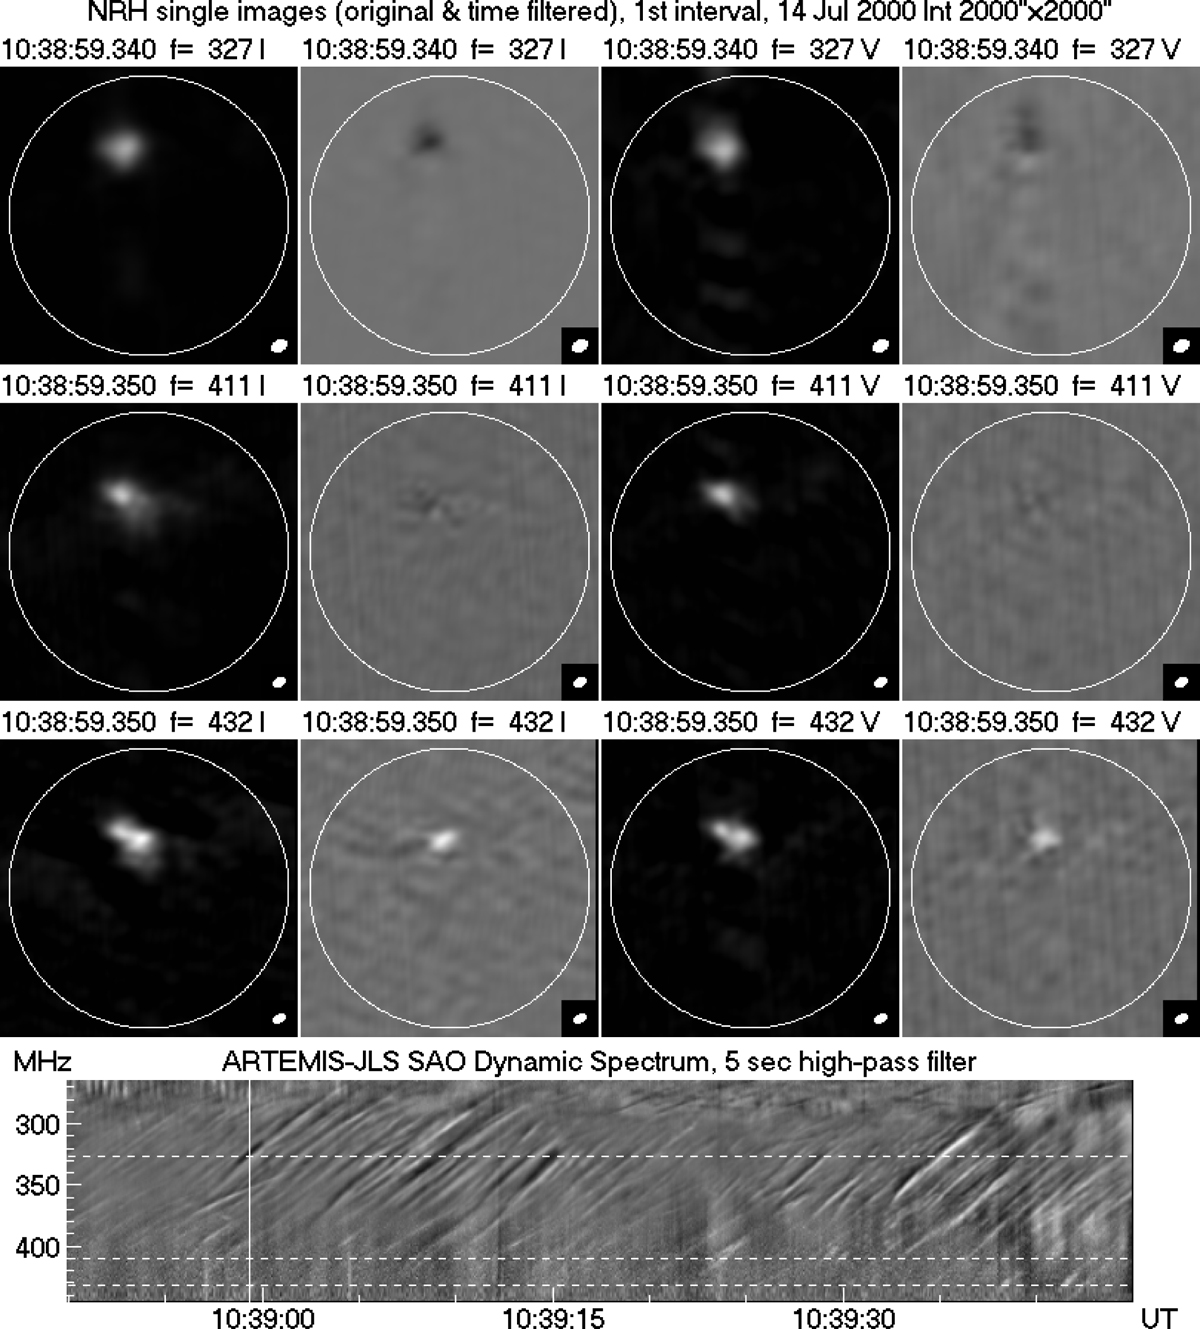
Frame from Movie 2, which shows the full sequence of 125 ms NRH images during Interval 1 at 327.0, (first row from the top), 410.5 (second row), and 432.0 MHz (third row). Each row shows the original and time-filtered images in Stokes I and V; right-hand circular polarization is white. A linear gray-scale color table was used for the displays, where black corresponds to the minimum and white to the maximum intensity during the entire interval of each image set. At the bottom we show the time-filtered SAO spectrum, extended by 5 s on either side; the vertical line marks the time of the images and the dashed horizontal lines the NRH frequencies.
Current usage metrics show cumulative count of Article Views (full-text article views including HTML views, PDF and ePub downloads, according to the available data) and Abstracts Views on Vision4Press platform.
Data correspond to usage on the plateform after 2015. The current usage metrics is available 48-96 hours after online publication and is updated daily on week days.
Initial download of the metrics may take a while.