Fig. 6.
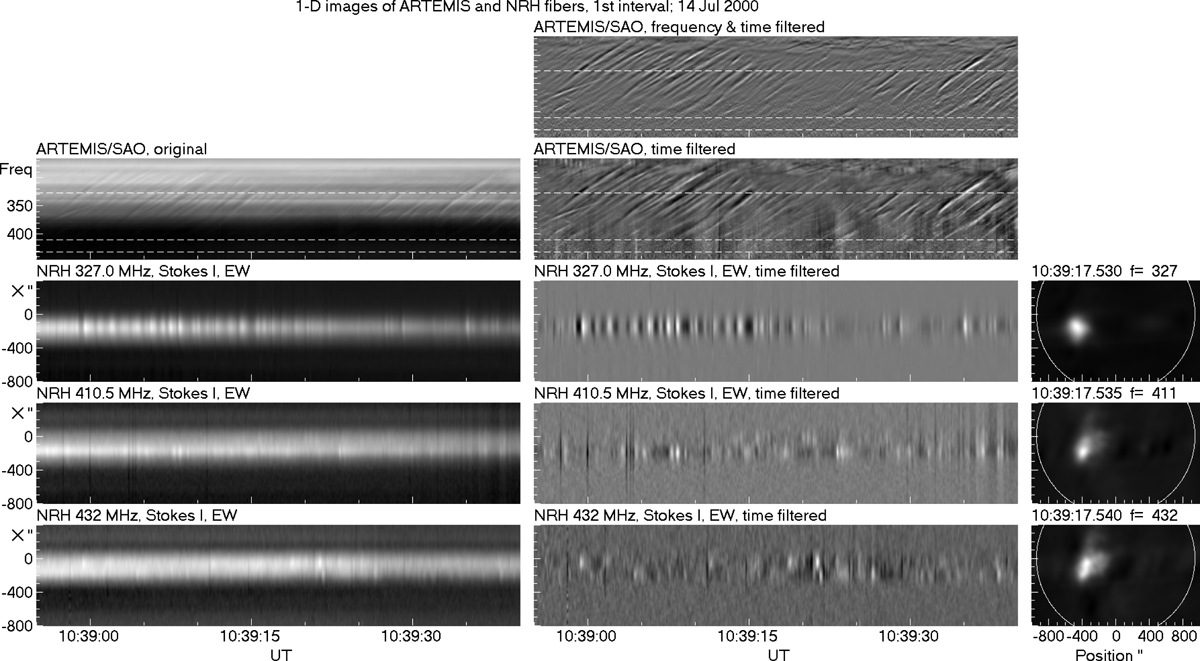
Left column: original SAO dynamic spectrum and 1D Nançay EW images (scans) as a function of time for Interval 1. Middle: corresponding filtered images; in the top row the dynamic spectrum has been filtered in both time and frequency, in the others in time only. Right: average NRH images with the same orientation as the 1D images (west limb up). Dashed horizontal lines in the spectra mark the NRH frequencies.
Current usage metrics show cumulative count of Article Views (full-text article views including HTML views, PDF and ePub downloads, according to the available data) and Abstracts Views on Vision4Press platform.
Data correspond to usage on the plateform after 2015. The current usage metrics is available 48-96 hours after online publication and is updated daily on week days.
Initial download of the metrics may take a while.