Fig. 5.
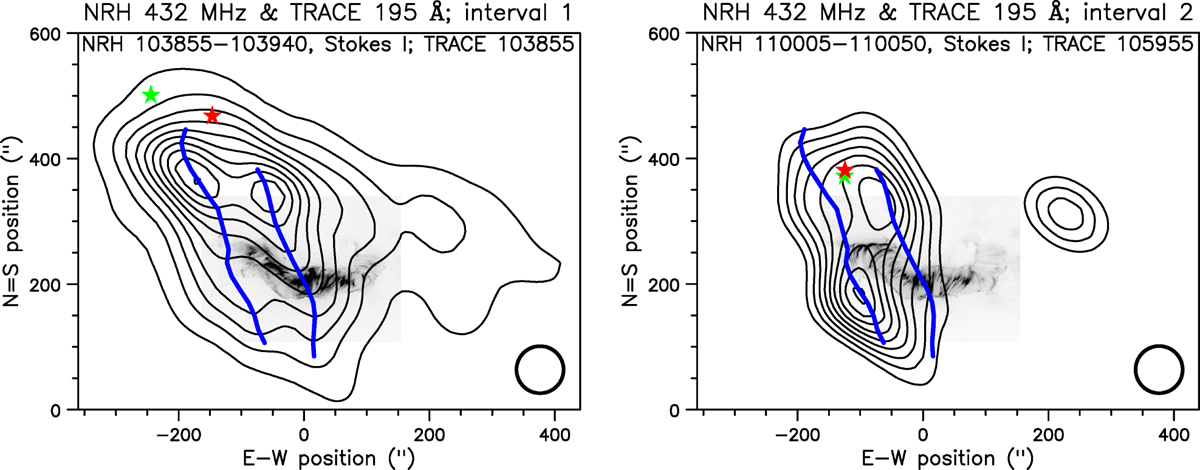
Contours of the average NRH images at 432 MHz during interval 1 (left) and interval 2 (right) superposed on top of the corresponding (negative) 195 Å TRACE images. The blue lines mark the position of the two stripes during the first interval. The red and green stars mark the position of the 327.0 and 237.0 MHz peaks, respectively. The NRH beam is plotted in the lower right corner.
Current usage metrics show cumulative count of Article Views (full-text article views including HTML views, PDF and ePub downloads, according to the available data) and Abstracts Views on Vision4Press platform.
Data correspond to usage on the plateform after 2015. The current usage metrics is available 48-96 hours after online publication and is updated daily on week days.
Initial download of the metrics may take a while.