Free Access
Fig. 4.
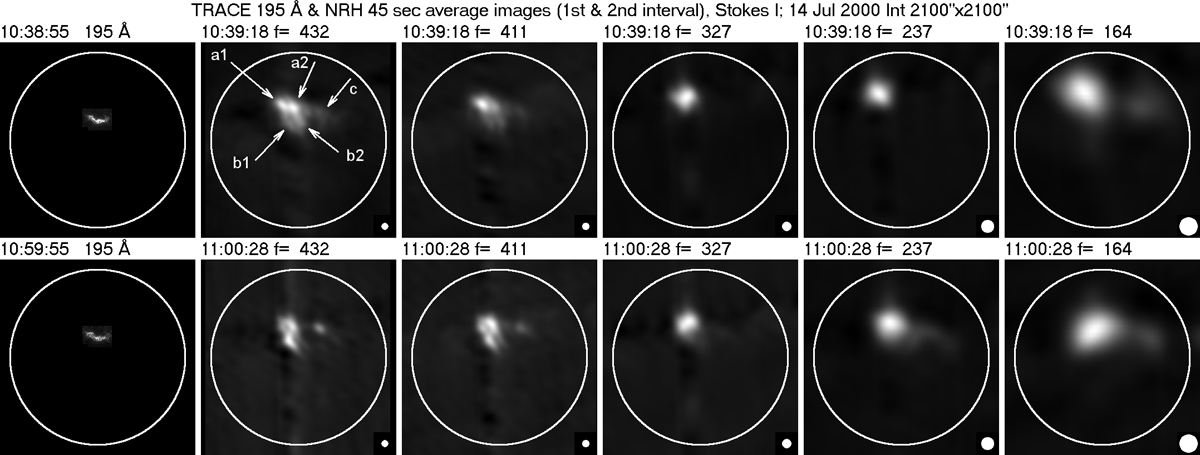
Average NRH images in total intensity (Stokes I) during the first (top) and the second (bottom) interval, together with the corresponding TRACE images in the 195 Å band (left column). For the NRH images we used a circular clean beam in order to enhance some features. All images are normalized to their peak intensity.
Current usage metrics show cumulative count of Article Views (full-text article views including HTML views, PDF and ePub downloads, according to the available data) and Abstracts Views on Vision4Press platform.
Data correspond to usage on the plateform after 2015. The current usage metrics is available 48-96 hours after online publication and is updated daily on week days.
Initial download of the metrics may take a while.