Fig. 2.
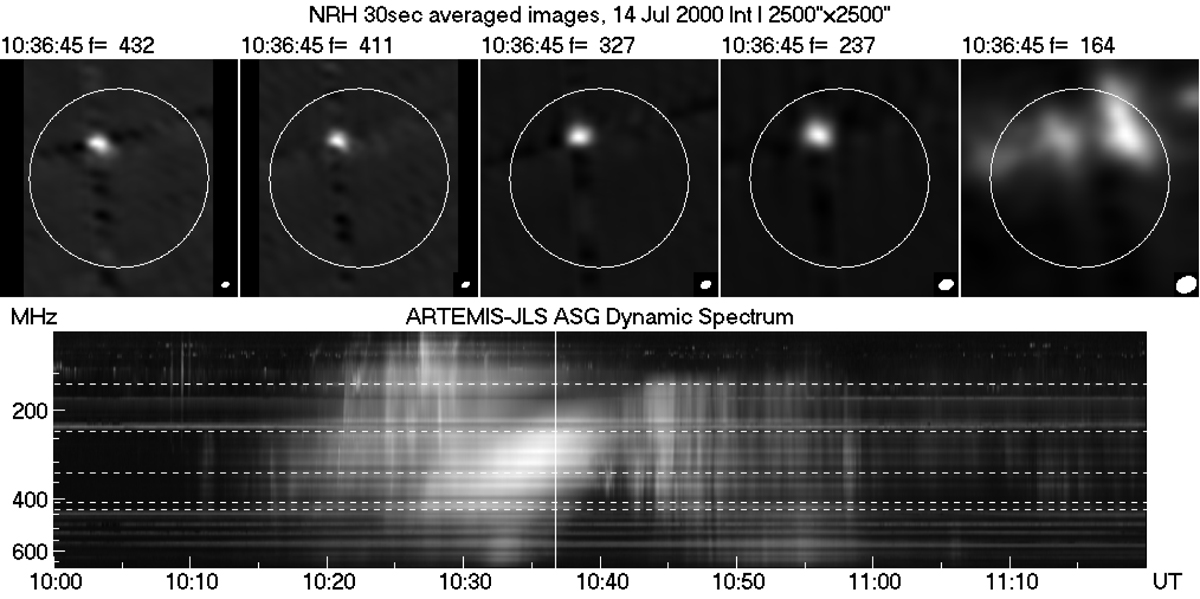
Frame from Movie 1, showing NRH images in Stokes I at all five frequencies. The images are averaged over 30 s and have been normalized so that the minimum intensity of each image is black and the peak intensity is white. The white circles mark the photospheric limb. The NRH beam is drawn in the lower right corner of each frame. The bottom panel shows the ASG dynamic spectrum, with the vertical white line marking the time of the images and the dashed horizontal lines marking the NRH frequencies.
Current usage metrics show cumulative count of Article Views (full-text article views including HTML views, PDF and ePub downloads, according to the available data) and Abstracts Views on Vision4Press platform.
Data correspond to usage on the plateform after 2015. The current usage metrics is available 48-96 hours after online publication and is updated daily on week days.
Initial download of the metrics may take a while.