Free Access
Fig. 12.
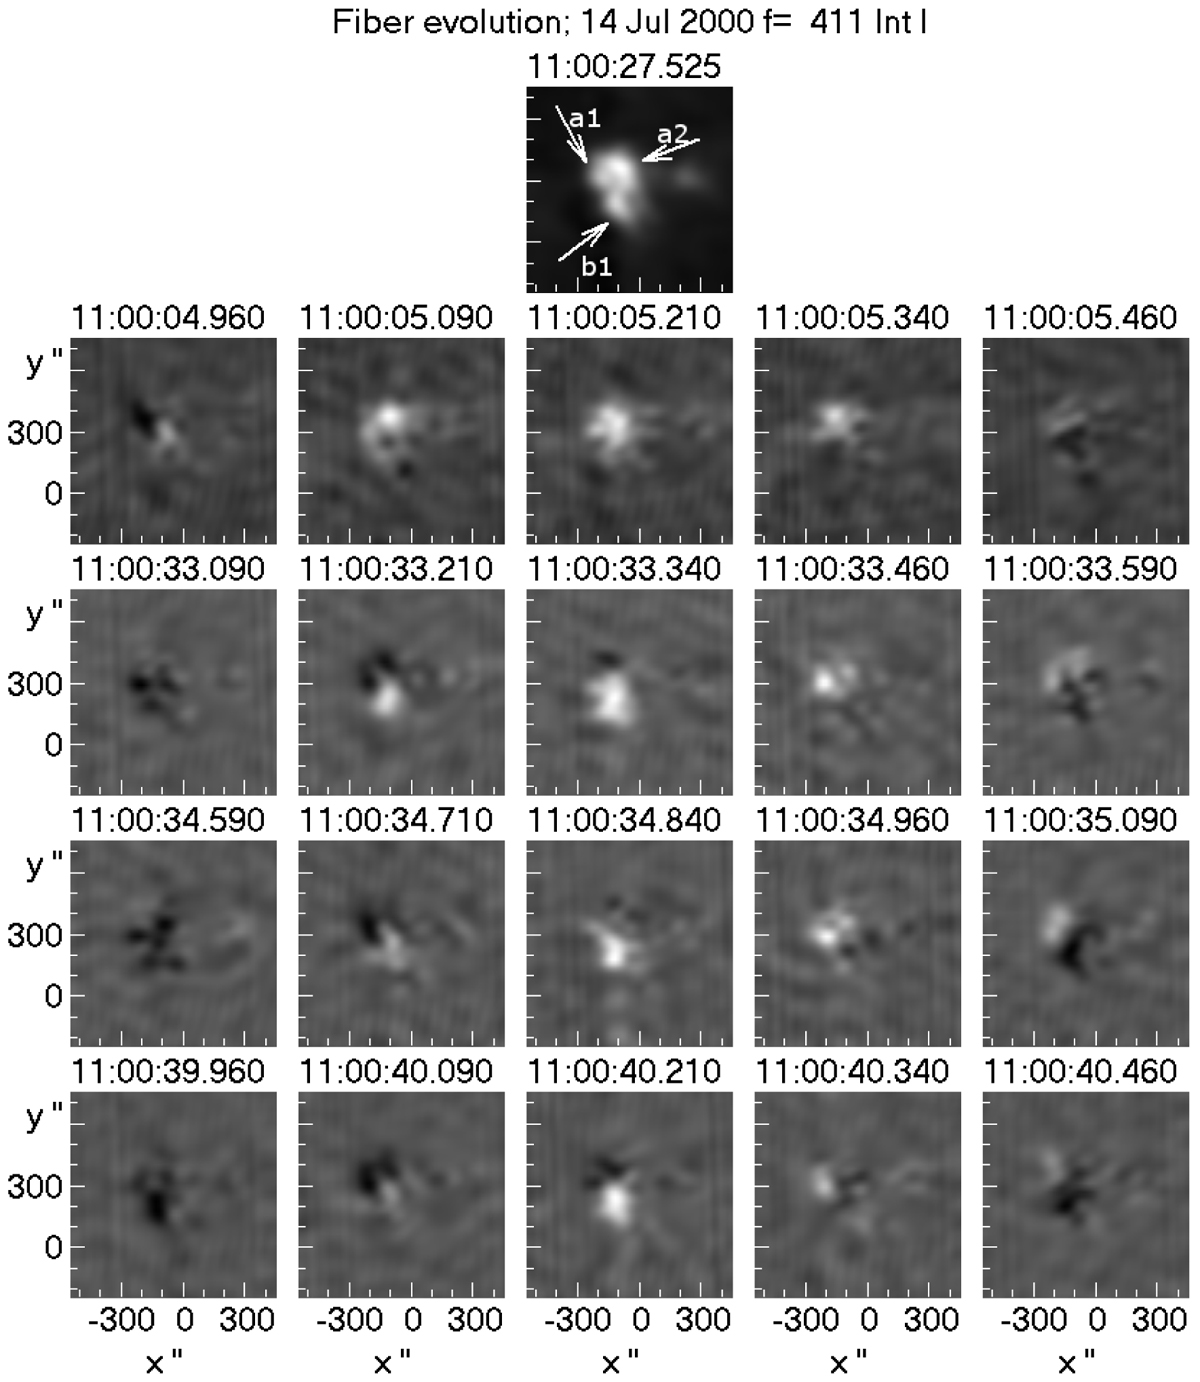
Time sequences of filtered NRH 2D images, showing the evolution of four fibers at 410.5 MHz during the second interval. These images were taken at intervals of 125 ms. We give the corresponding average image in the top row for reference.
Current usage metrics show cumulative count of Article Views (full-text article views including HTML views, PDF and ePub downloads, according to the available data) and Abstracts Views on Vision4Press platform.
Data correspond to usage on the plateform after 2015. The current usage metrics is available 48-96 hours after online publication and is updated daily on week days.
Initial download of the metrics may take a while.