Fig. 3.
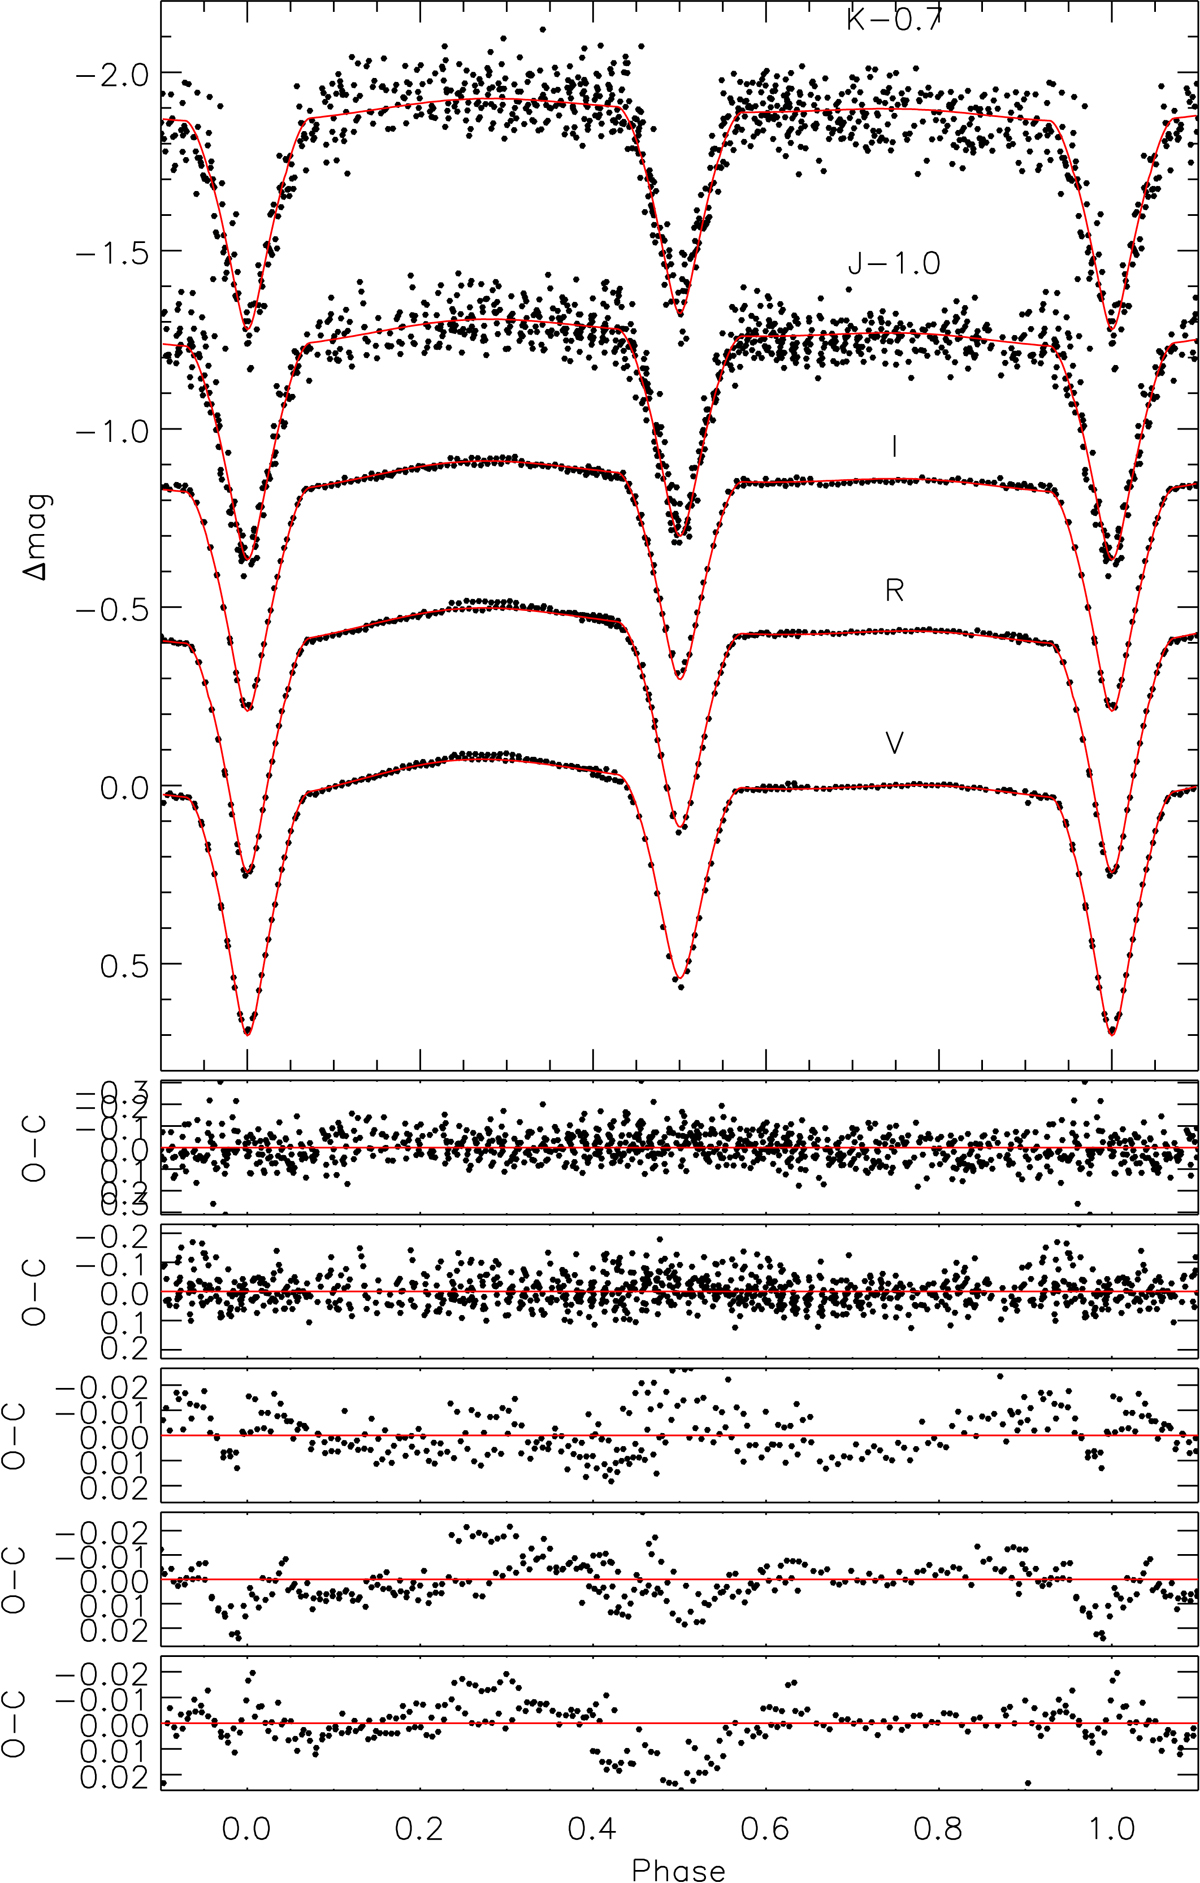
Top panel: NSVS 10653195 light curves (points) and PHOEBE fitted model (red lines) with the parameters of Table 9. From top to bottom: K, J, I, R, and V differential light curves. K and J band TCS filters are displaced −0.7 and −0.1 magnitudes, respectively, for a better viewing. Lower panels: residuals of the fits in the same order as the light curves in the top panel. We note the different vertical scales of the panels.
Current usage metrics show cumulative count of Article Views (full-text article views including HTML views, PDF and ePub downloads, according to the available data) and Abstracts Views on Vision4Press platform.
Data correspond to usage on the plateform after 2015. The current usage metrics is available 48-96 hours after online publication and is updated daily on week days.
Initial download of the metrics may take a while.