Fig. 21.
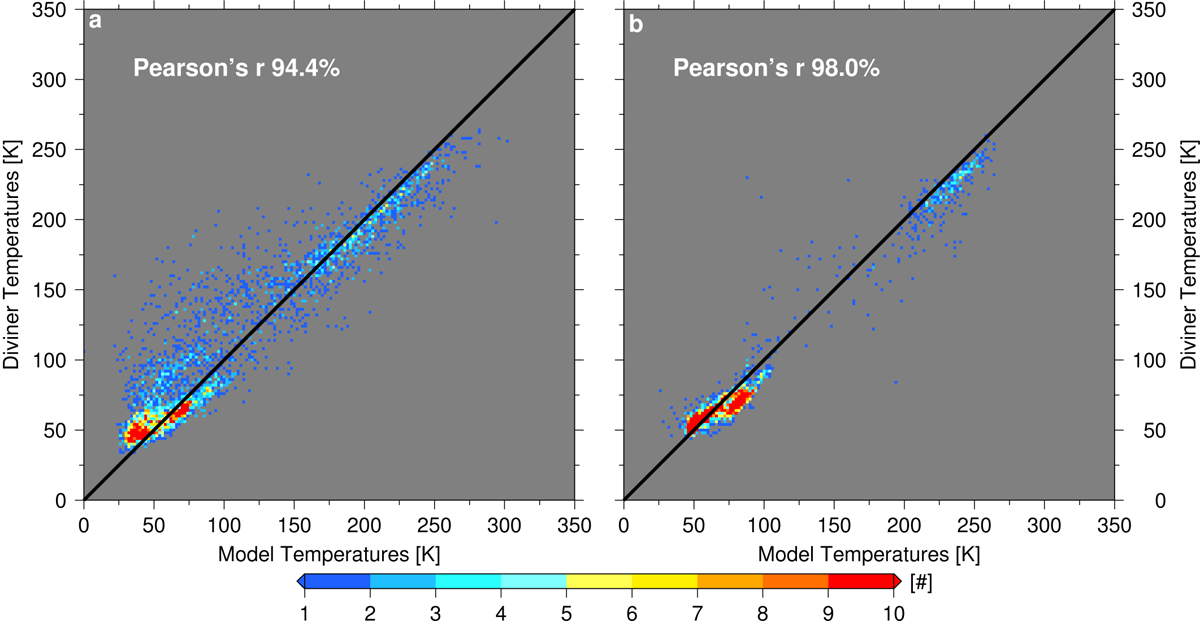
Scatter density plot with 2 K step-size of Figs. 20c,g over the corresponding terrain in Figs. 20b,f to visualize the good overall agreement of the two maps. The derived Pearson’s correlation coefficients reach (a) 94.4% for the comparison of the model and Diviner measurement at the north pole and (b) 98.0% at the south pole.
Current usage metrics show cumulative count of Article Views (full-text article views including HTML views, PDF and ePub downloads, according to the available data) and Abstracts Views on Vision4Press platform.
Data correspond to usage on the plateform after 2015. The current usage metrics is available 48-96 hours after online publication and is updated daily on week days.
Initial download of the metrics may take a while.