Fig. 20.
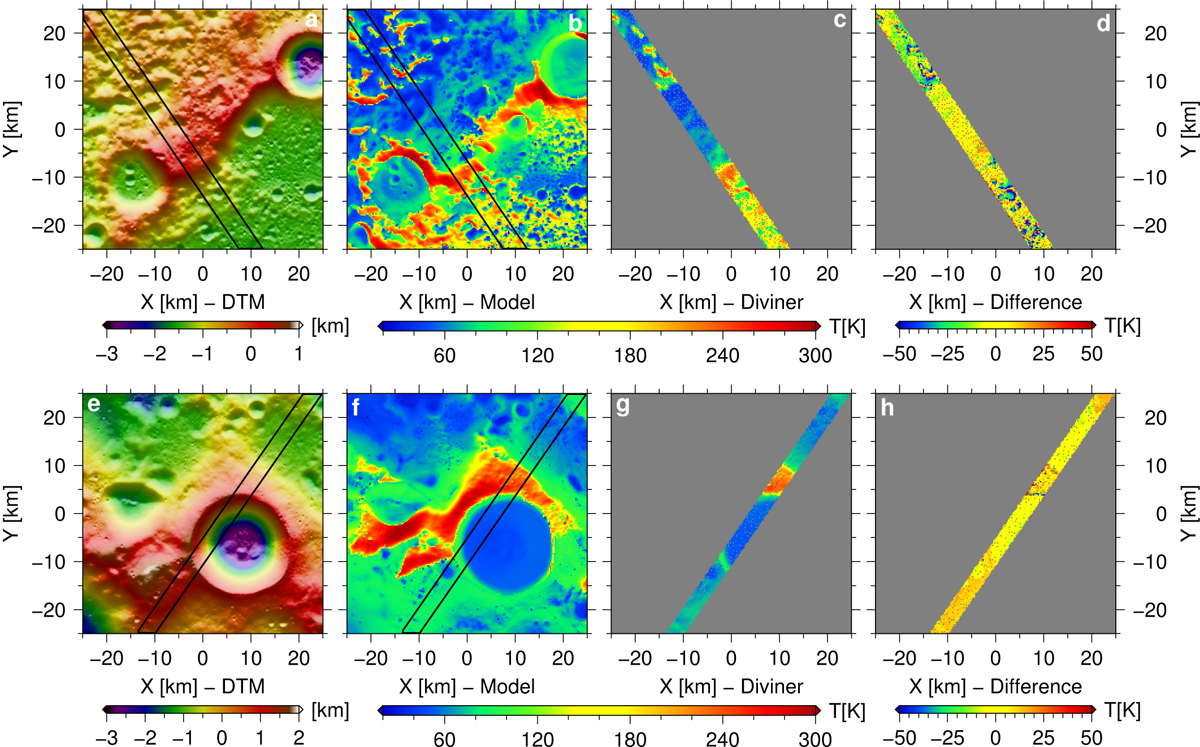
Our model temperatures compared to temperatures derived from Diviner data. (a–d) North pole and (e–h) South pole. (a),(e) DTM for which temperatures were modeled. (b),(f) Model temperatures at exact times of Diviner measurements. (c),(g) Diviner measurements taken on February 2, 2010, in (a) from orbit 2763 at 01:20 am and in (b) from orbit 2762 at 00:30 am. (d),(h) The difference between the model temperatures and the Diviner measurements. We note that no interpolation was used. Maps are displayed in polar gnomonic map projection and are color-coded by height (a),(e) and temperature (b–d),(f–h). For context the footprints of the Diviner measurements are indicated as black lines in (a),(b) and (e),(f).
Current usage metrics show cumulative count of Article Views (full-text article views including HTML views, PDF and ePub downloads, according to the available data) and Abstracts Views on Vision4Press platform.
Data correspond to usage on the plateform after 2015. The current usage metrics is available 48-96 hours after online publication and is updated daily on week days.
Initial download of the metrics may take a while.