Fig. 17.
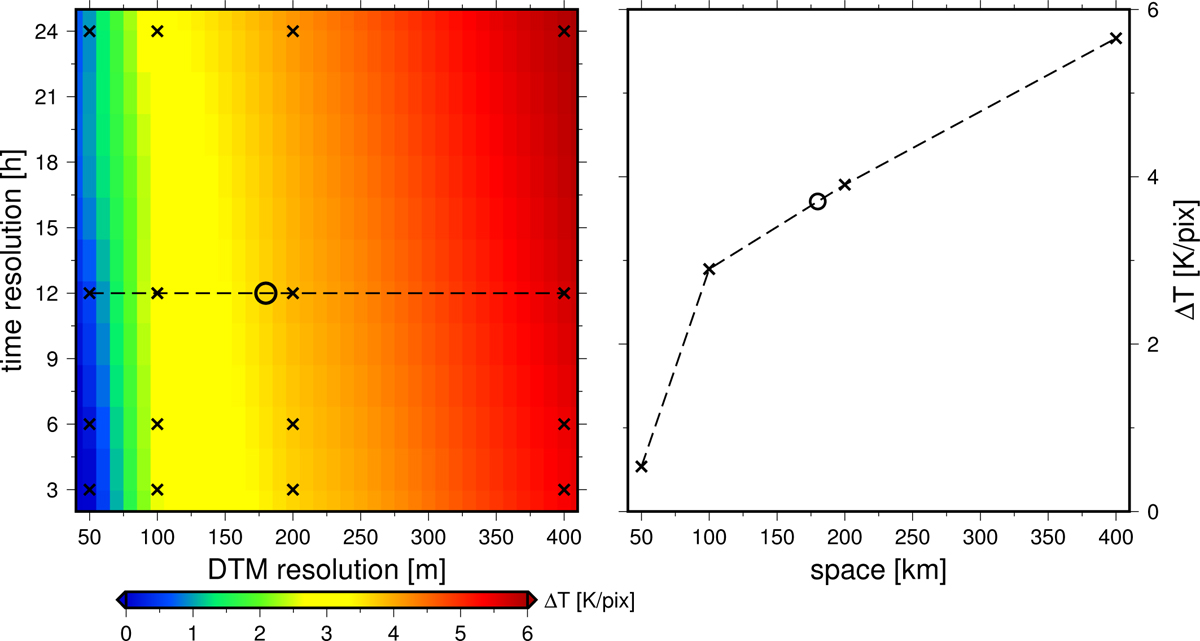
(a) Mean absolute errors (L1-norm) of 16 test cases (black crosses) calculated using different resolution in time and space. The data point at 50 m DTM resolution and 3 h integration time-step serves as a benchmark; cf. lower left cross. The black dashed line shows the location of the profile displayed in (b) and the black circle indicates our chosen DTM resolution of 180 m pixel−1. The mean absolute errors are color-coded. (b) Profile showing the mean absolute error with increasing resolutions at a fixed time-step of 12 h. Our adopted DTM resolution is indicated as a black circle.
Current usage metrics show cumulative count of Article Views (full-text article views including HTML views, PDF and ePub downloads, according to the available data) and Abstracts Views on Vision4Press platform.
Data correspond to usage on the plateform after 2015. The current usage metrics is available 48-96 hours after online publication and is updated daily on week days.
Initial download of the metrics may take a while.