Fig. 16.
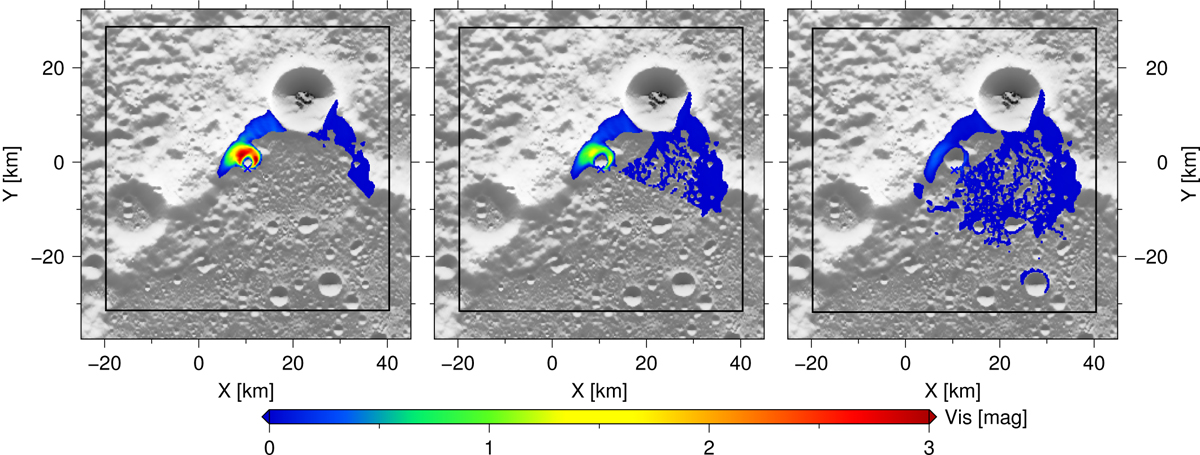
Visible terrain calculated for three different locations within our chosen 60 × 60 km window. The maps are displayed in gnomonic map projection and color-coded by a dimensionless value describing the magnitude of influence that a pixel has on the center of the window (blue cross). Although the locations are only one pixel apart from each other there is a vast difference in magnitudes and visible terrain.
Current usage metrics show cumulative count of Article Views (full-text article views including HTML views, PDF and ePub downloads, according to the available data) and Abstracts Views on Vision4Press platform.
Data correspond to usage on the plateform after 2015. The current usage metrics is available 48-96 hours after online publication and is updated daily on week days.
Initial download of the metrics may take a while.