Fig. 13.
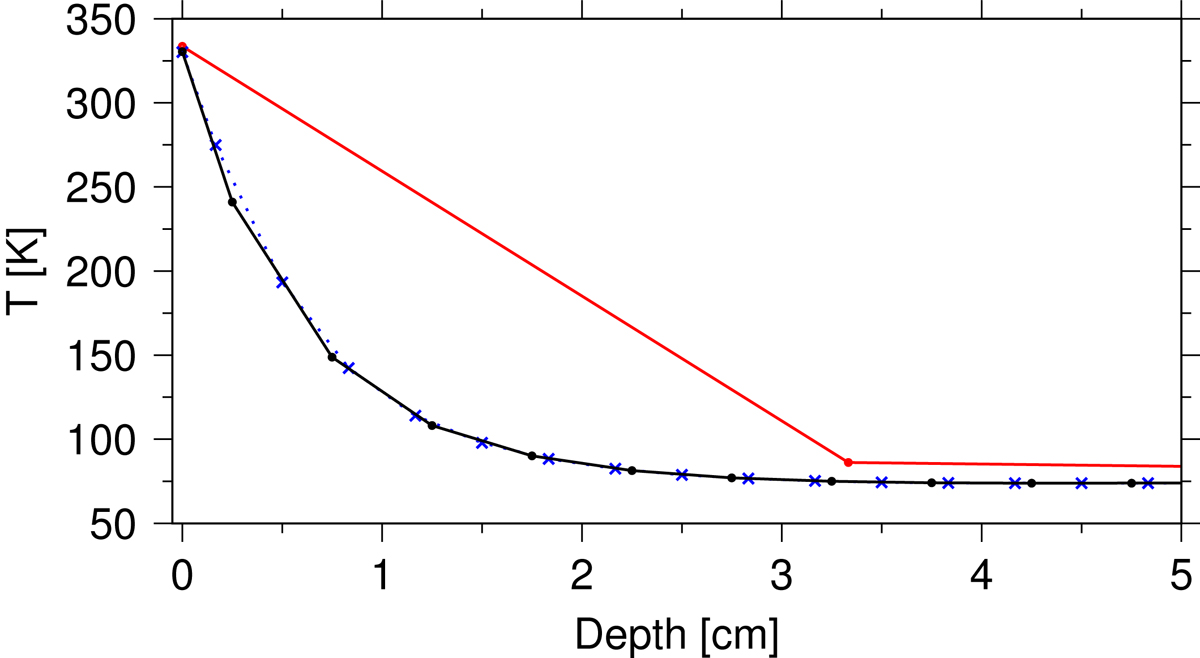
Temperatures evaluated over a ten-day period starting from a uniform 100 K temperature distribution using different discretizations. Temperature profiles with constant cell sizes are shown for the upper 5 cm for 30 (red) and 600 (blue) cells and one profile is shown using an irregularly spaced grid with 29 cells (black). We note that for all profiles we additionally show the corresponding surface temperatures, that is, at 0 cm depth. The differences between the irregularly spaced grid with 29 cells and 30 cells of constant size are significant, whereas compared to the results obtained with a grid using 600 cells of constant size they are negligible. The irregularly spaced grid was adopted in this study.
Current usage metrics show cumulative count of Article Views (full-text article views including HTML views, PDF and ePub downloads, according to the available data) and Abstracts Views on Vision4Press platform.
Data correspond to usage on the plateform after 2015. The current usage metrics is available 48-96 hours after online publication and is updated daily on week days.
Initial download of the metrics may take a while.