Fig. 11.
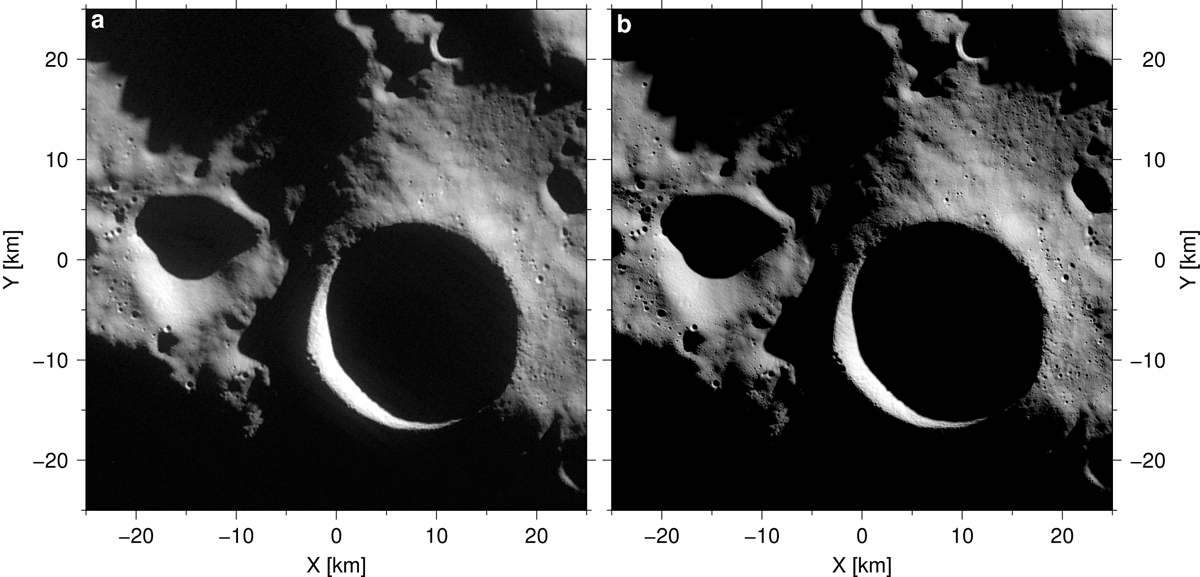
50 × 50 km region of interest centered at the lunar south pole. (a) Cutout of WAC image M172692029ME displayed at 100 m pixel−1 resolution. (b) Synthetically illuminated LOLA DTM at 20 m pixel−1 resolution using the image acquisition time of the WAC image shown in (a) as the input time for simulation. Maps are displayed in gnomonic map projection.
Current usage metrics show cumulative count of Article Views (full-text article views including HTML views, PDF and ePub downloads, according to the available data) and Abstracts Views on Vision4Press platform.
Data correspond to usage on the plateform after 2015. The current usage metrics is available 48-96 hours after online publication and is updated daily on week days.
Initial download of the metrics may take a while.