Fig. 2.
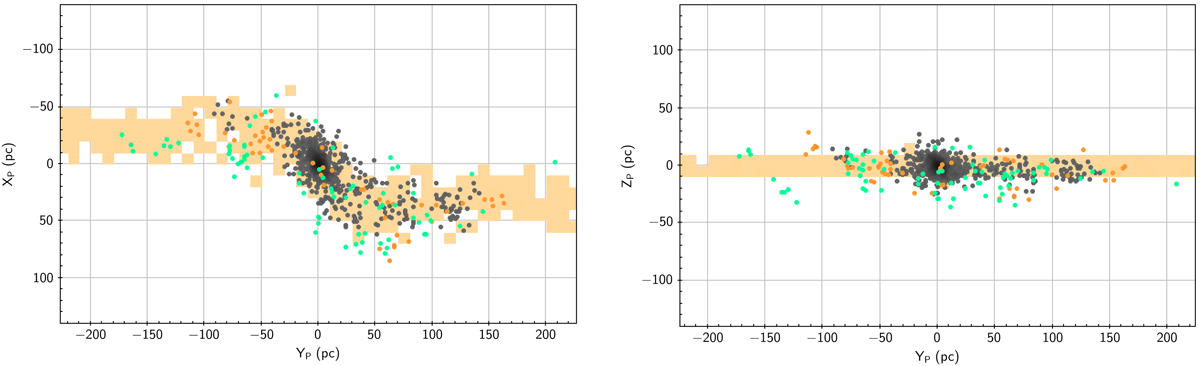
Praesepe cluster and its tidal tails shown in the YP, Xp-plane (left) and the YP, Zp-plane (right). Stars selected in Gaia DR2 are shown as dots colour coded by their pcont-values (pcont < 0.015 in grey, pcont ≈ 0.1 in orange and pcont ≈ 0.5 in light green). The location of the simulated tidal tails from the model by Kharchenko et al. (2009) is indicated as beige-coloured structures.
Current usage metrics show cumulative count of Article Views (full-text article views including HTML views, PDF and ePub downloads, according to the available data) and Abstracts Views on Vision4Press platform.
Data correspond to usage on the plateform after 2015. The current usage metrics is available 48-96 hours after online publication and is updated daily on week days.
Initial download of the metrics may take a while.