Fig. 2.
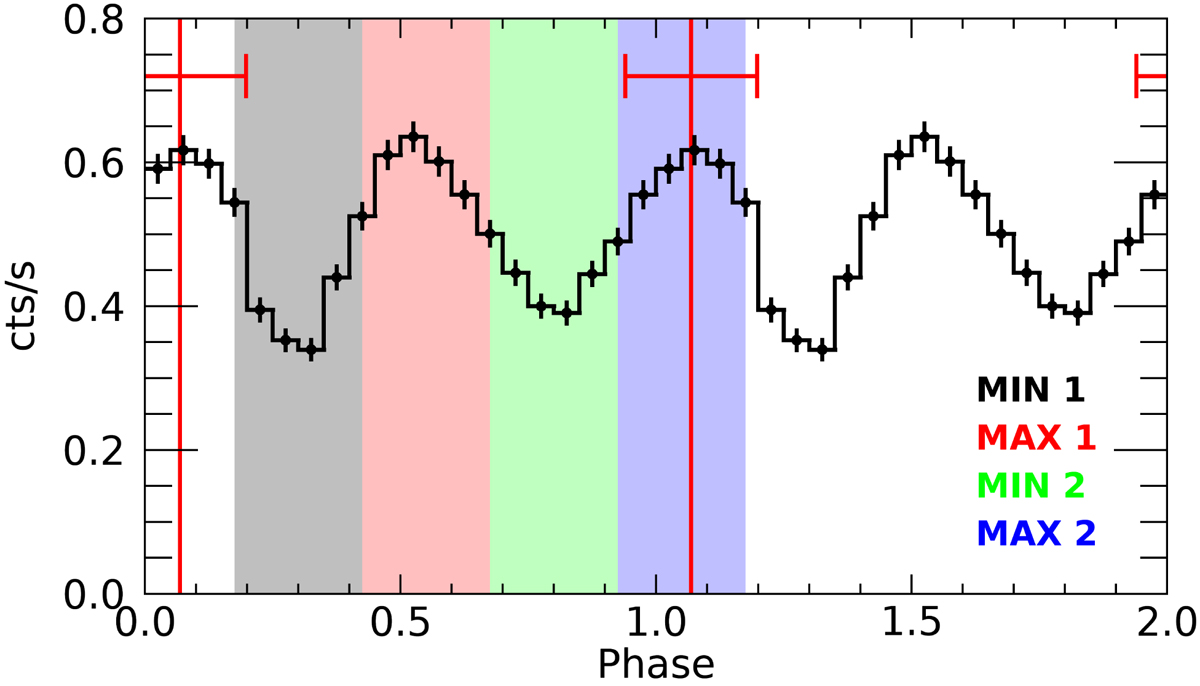
Pulse profile of PSR J0726–2612 in the energy range 0.15–1.5 keV obtained by folding the EPIC-pn data in 20 phase bins at the period derived from the radio ephemeris (Table 1). The vertical red line represents the location of the radio pulse (derived from Speagle et al. 2011), with its uncertainty (1σ). The colored bands indicate the intervals used for the phase-resolved spectroscopy.
Current usage metrics show cumulative count of Article Views (full-text article views including HTML views, PDF and ePub downloads, according to the available data) and Abstracts Views on Vision4Press platform.
Data correspond to usage on the plateform after 2015. The current usage metrics is available 48-96 hours after online publication and is updated daily on week days.
Initial download of the metrics may take a while.