Fig. 1.
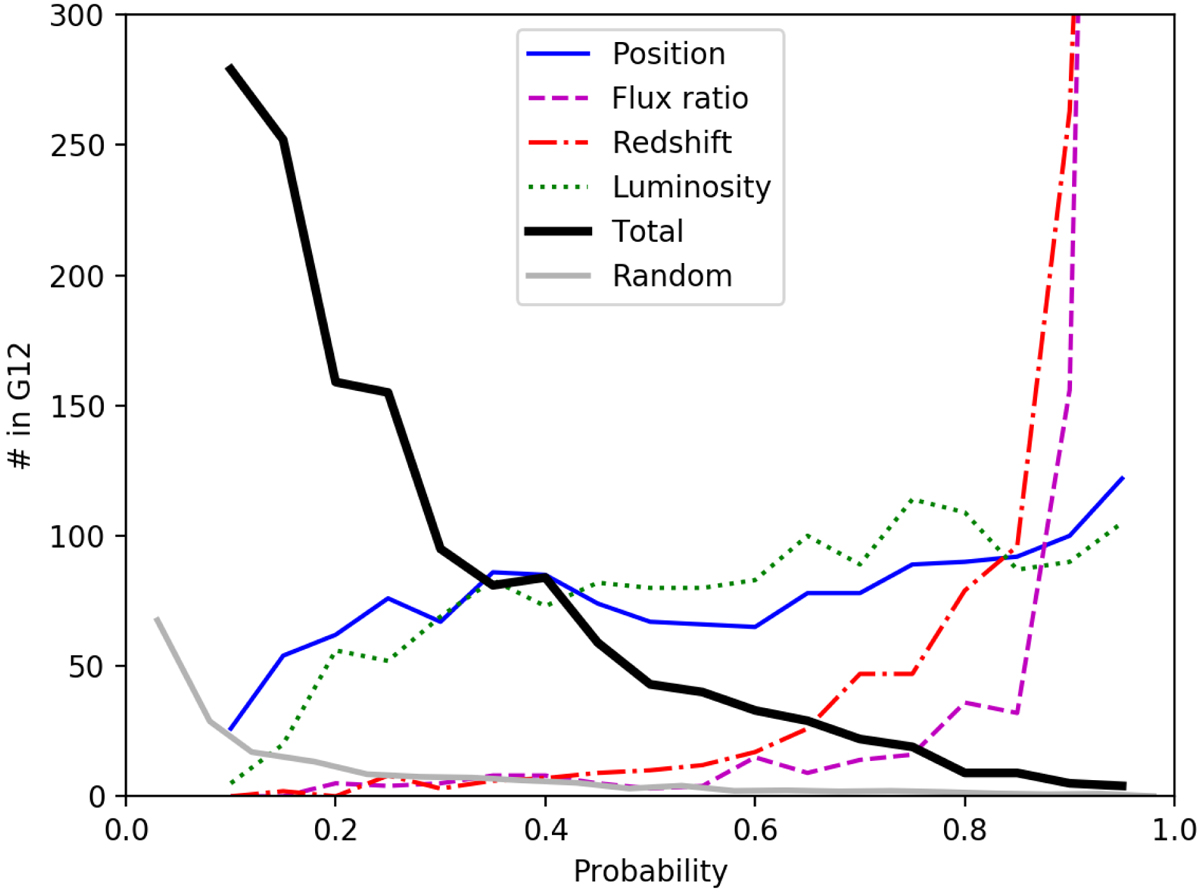
Comparison for the GAMA12 field of the variation of the number of sources with the different probabilities associated with the observables considered in this work. Similar results are obtained for the other fields. The total probability is shown as a thick black line while the estimated probability of random pairs is shown as a grey line.
Current usage metrics show cumulative count of Article Views (full-text article views including HTML views, PDF and ePub downloads, according to the available data) and Abstracts Views on Vision4Press platform.
Data correspond to usage on the plateform after 2015. The current usage metrics is available 48-96 hours after online publication and is updated daily on week days.
Initial download of the metrics may take a while.