Fig. 6
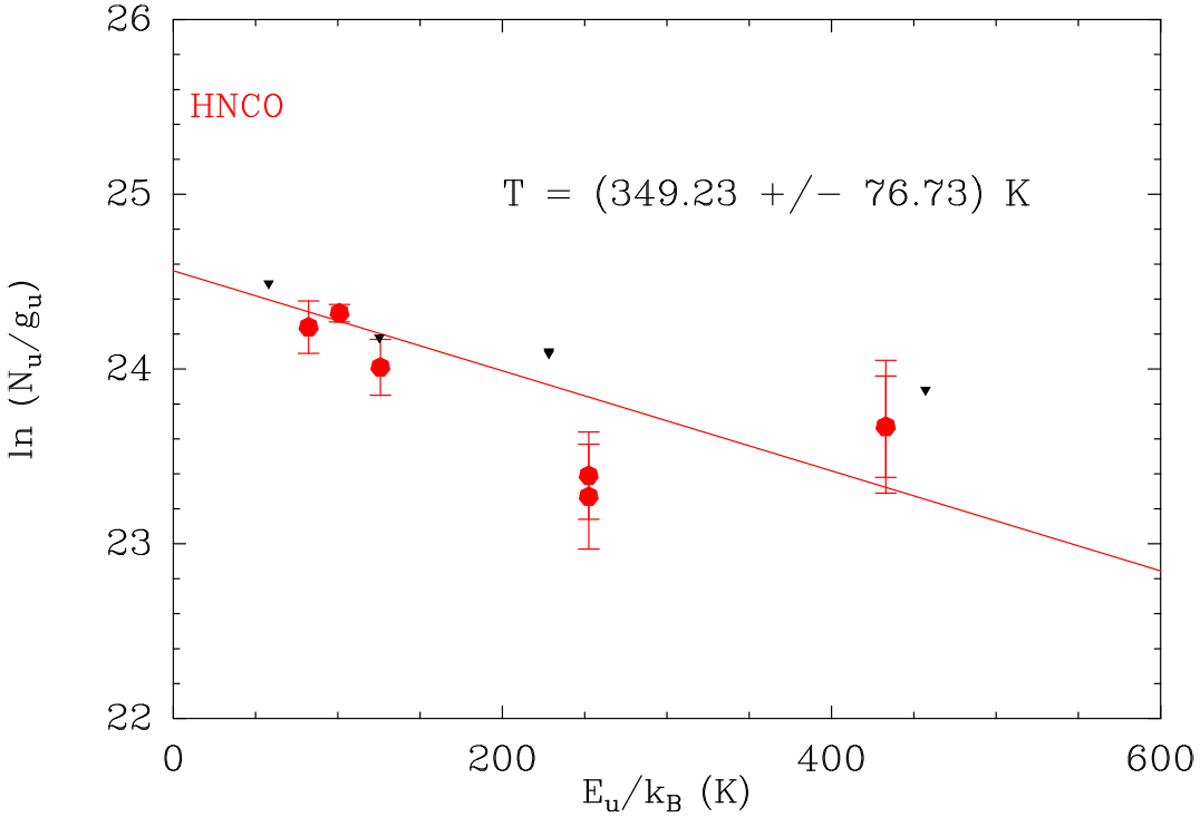
HNCO temperature diagram in direction of NGC 7538–IRS1. Red dots indicate detected and partially detected lines, while dark triangles mark blended lines. Error bars (3σ) only reflect the uncertainties in the Gaussian fit of the lines.
Current usage metrics show cumulative count of Article Views (full-text article views including HTML views, PDF and ePub downloads, according to the available data) and Abstracts Views on Vision4Press platform.
Data correspond to usage on the plateform after 2015. The current usage metrics is available 48-96 hours after online publication and is updated daily on week days.
Initial download of the metrics may take a while.