Fig. 5.
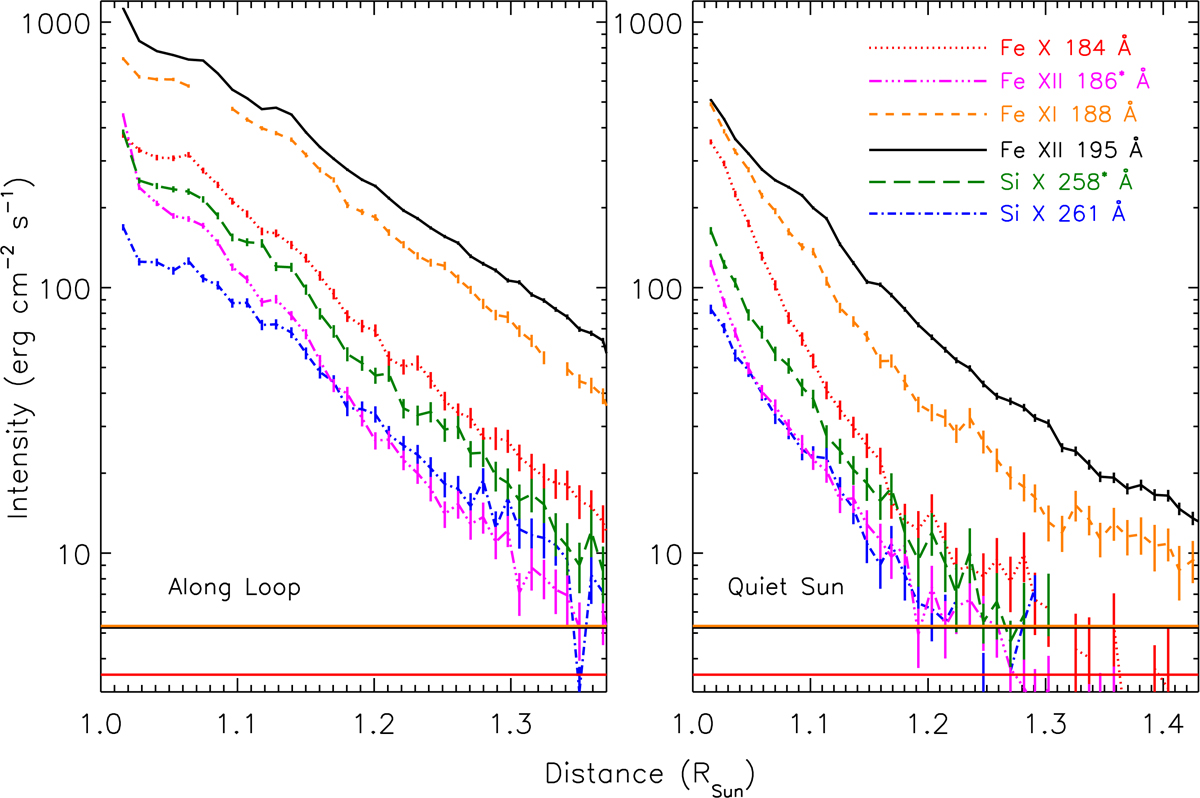
Intensity obtained from Fe X 184.54, Fe XII 186.88*, Fe XI 188.23, Fe XII 195.12, and Si X 258.37*, 261.04 Å spectral lines along the coronal loop (left panel) and quiet Sun region (right panel) with height. The intensities are recalibrated using the method of Del Zanna (2013). The asterisks denote respective spectral lines are density sensitive. Horizontal lines denote expected level of scattered light as per Ugarte (2010).
Current usage metrics show cumulative count of Article Views (full-text article views including HTML views, PDF and ePub downloads, according to the available data) and Abstracts Views on Vision4Press platform.
Data correspond to usage on the plateform after 2015. The current usage metrics is available 48-96 hours after online publication and is updated daily on week days.
Initial download of the metrics may take a while.