Free Access
Fig. 3.
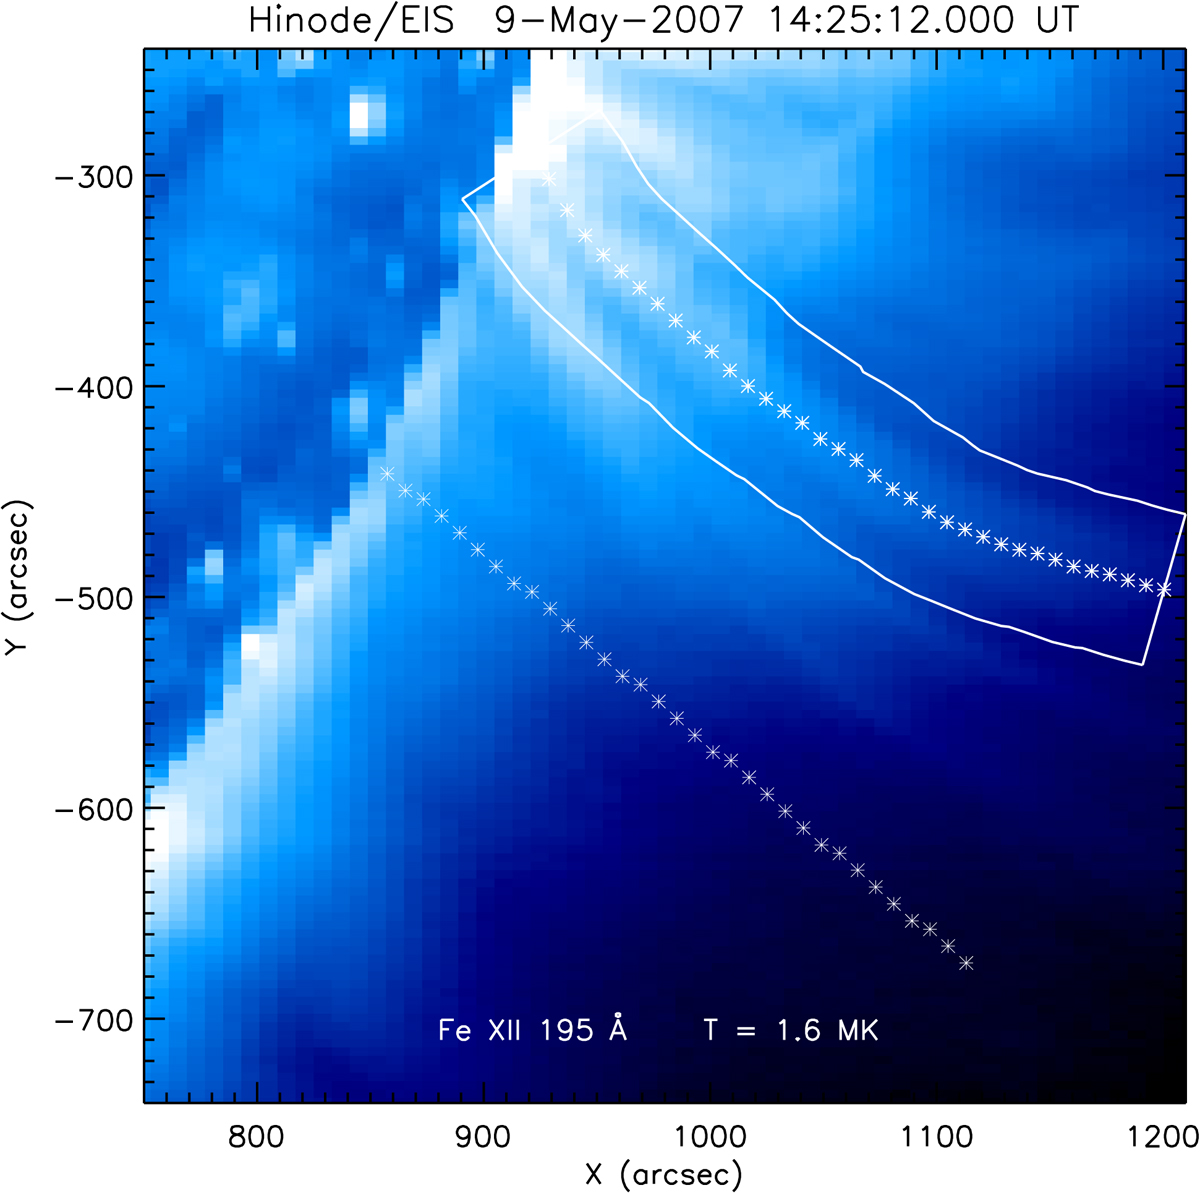
Intensity maps obtained from Fe XII 195 Å showing the loop traced out to study in detail. The quiet Sun region is also traced out for the purpose of determining the background. The white curved box indicates region chosen along the curved loop.
Current usage metrics show cumulative count of Article Views (full-text article views including HTML views, PDF and ePub downloads, according to the available data) and Abstracts Views on Vision4Press platform.
Data correspond to usage on the plateform after 2015. The current usage metrics is available 48-96 hours after online publication and is updated daily on week days.
Initial download of the metrics may take a while.