Fig. 2.
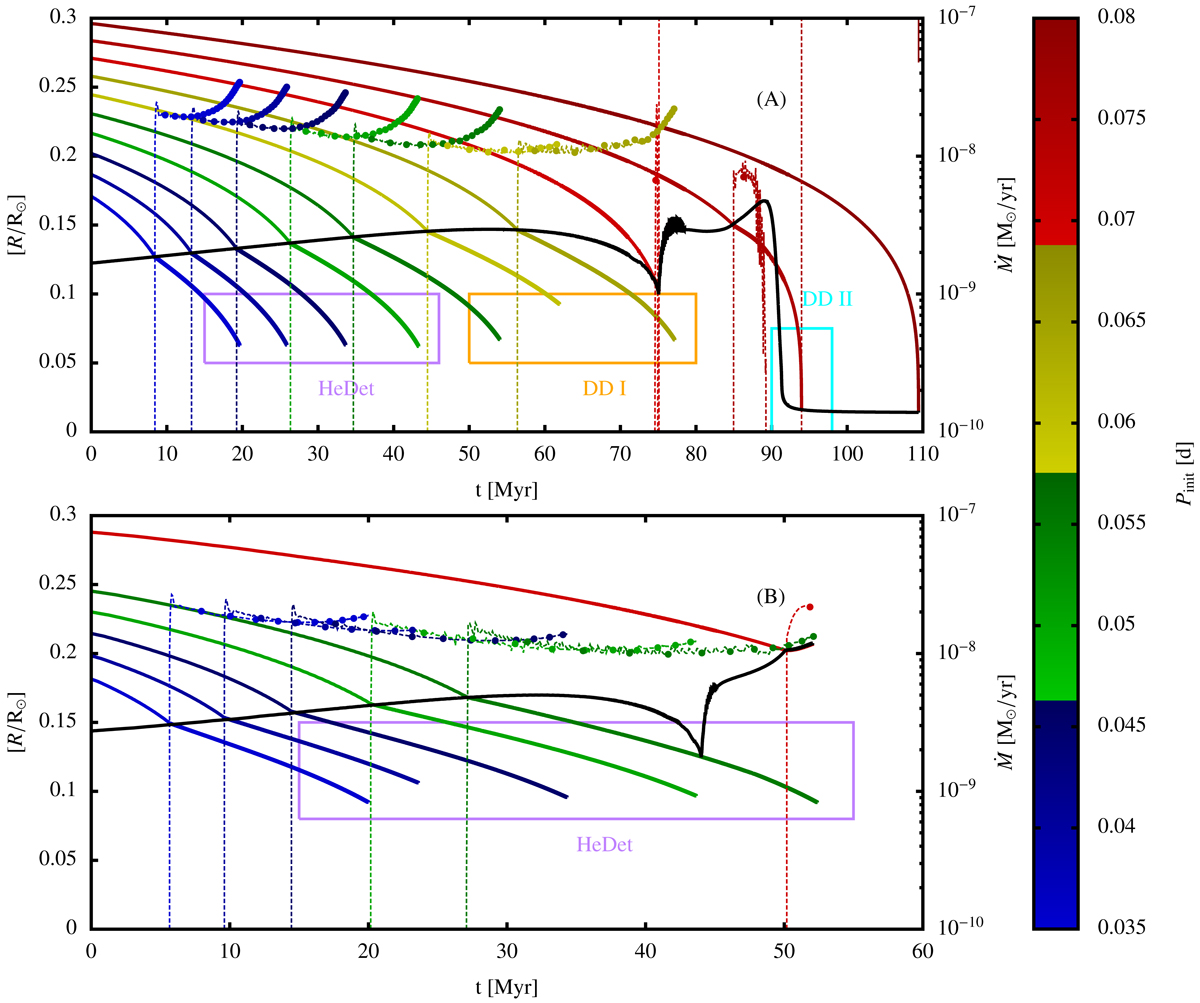
Evolution of essential binary interaction parameters for two sets of representative model sequences. Color indicates the initial orbital period (Pinit) of the system. Lines of the same color are valid for the same initial orbital period. RRL,d, represented by the bold lines, is the radius of the donor star’s Roche lobe. Ṁ is the mass transfer rate, represented by the thin dash-dotted lines. The radius of the donor star, Rd, is represented by the thick black line. Each plot shows all model sequences obtained for the entire range of initial orbital periods for a single pair of initial donor star (Md,i) and WD (MWD,i) masses. The parameters chosen for panel (A) are Md,i = 0.55 M⊙ and MWD,i = 1.10 M⊙ and for panel (B)Md,i = 0.65 M⊙ and MWD,i = 1.10 M⊙. Obtained outcomes are indicated by the rectangles. We note that in graph (B), the systems with Pinit = 0.06 d (see Fig. 3) and Pinit = 0.065 d (see Fig. 5), have been left out for clarity.
Current usage metrics show cumulative count of Article Views (full-text article views including HTML views, PDF and ePub downloads, according to the available data) and Abstracts Views on Vision4Press platform.
Data correspond to usage on the plateform after 2015. The current usage metrics is available 48-96 hours after online publication and is updated daily on week days.
Initial download of the metrics may take a while.