Fig. 5
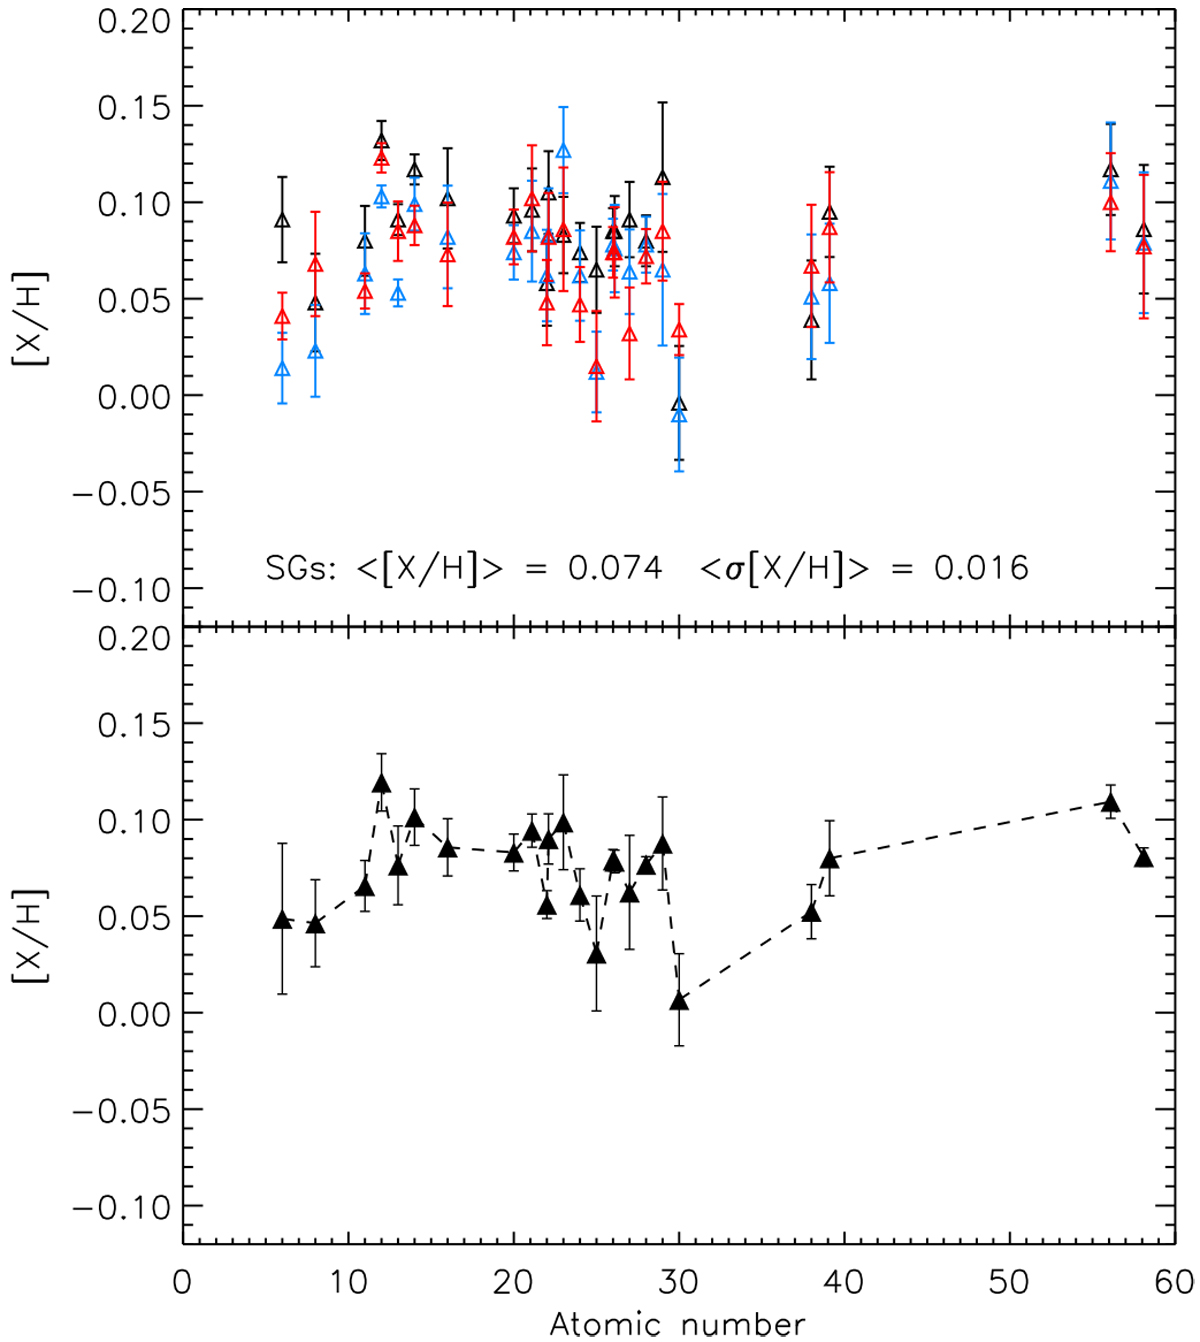
Top panel: elemental abundances of our subgiant stars as a function of atomic number; black, blue, and red triangles represent the elemental abundances of Y519, Y923, and Y1844, respectively. Bottom panel: similar to the top panel, but for the average abundances of the subgiant stars (black filled triangles). The error bars represent the standard deviations of the mean values.
Current usage metrics show cumulative count of Article Views (full-text article views including HTML views, PDF and ePub downloads, according to the available data) and Abstracts Views on Vision4Press platform.
Data correspond to usage on the plateform after 2015. The current usage metrics is available 48-96 hours after online publication and is updated daily on week days.
Initial download of the metrics may take a while.