Fig. 2
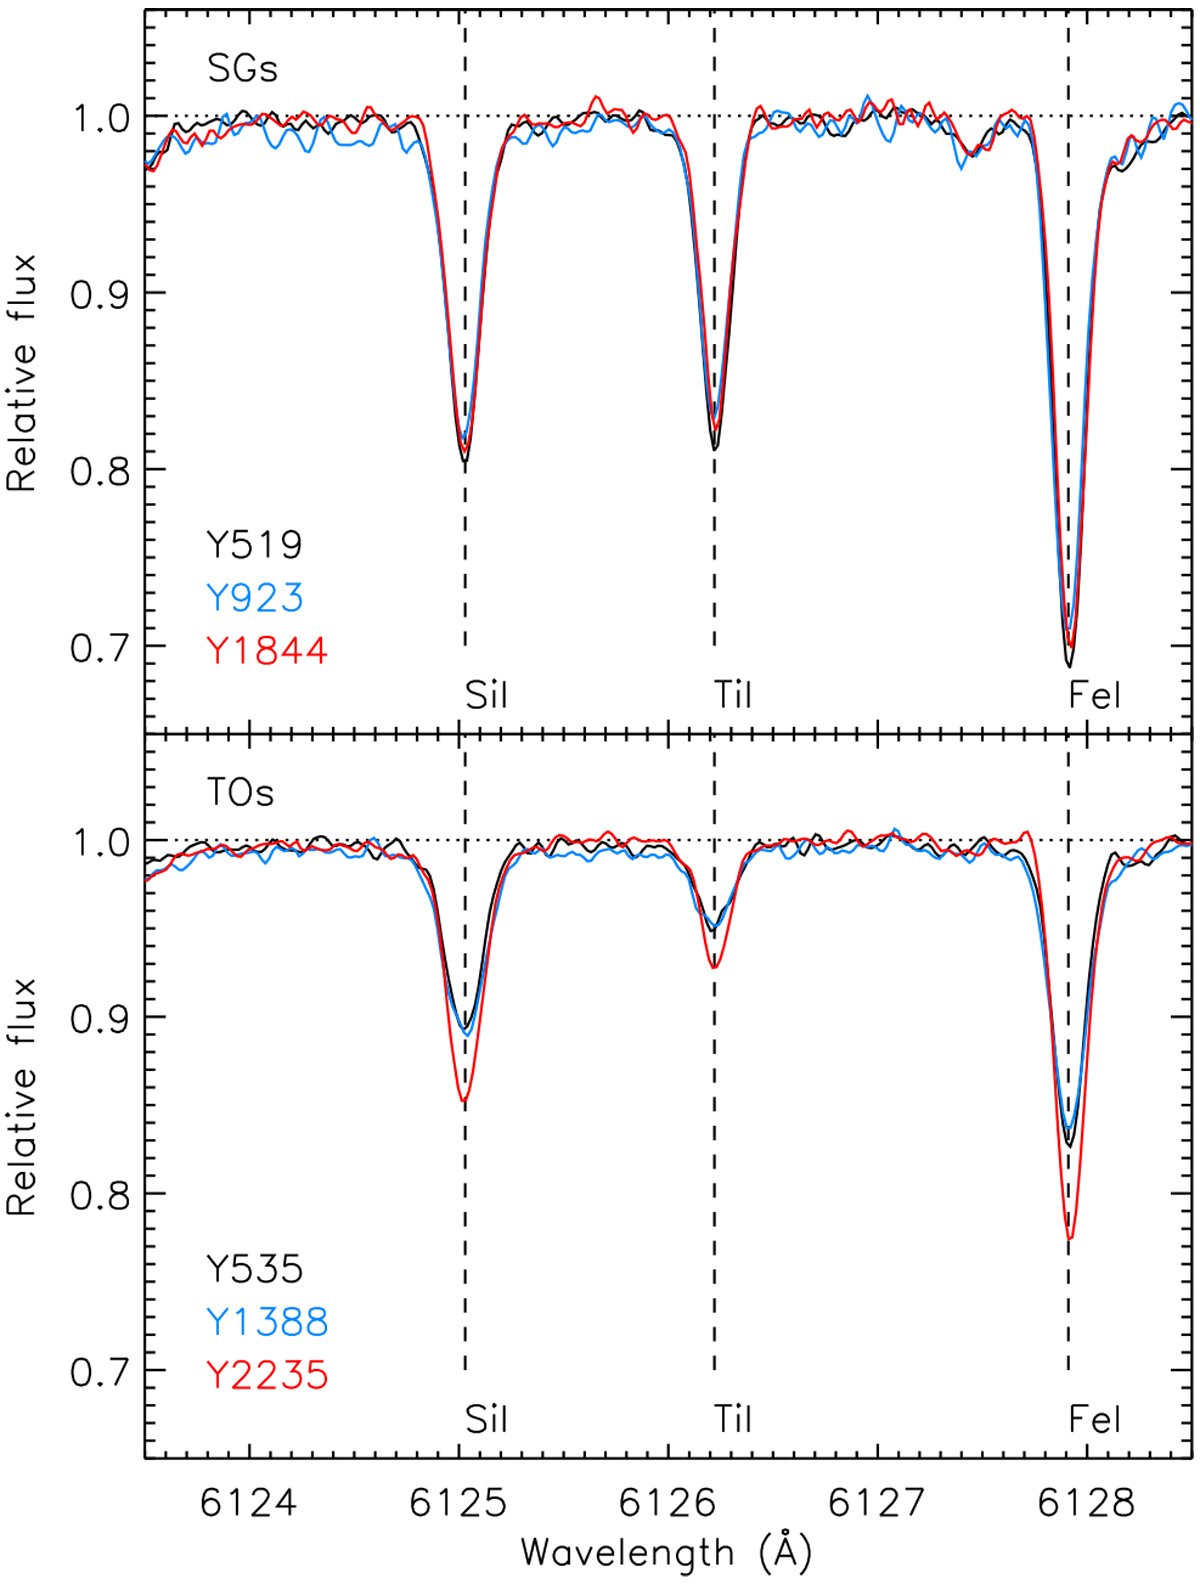
Top panel: portion of the reduced spectra for the subgiant stars in our sample; Y519, Y923, and Y1844 are plotted in black, blue, and red, respectively. A few atomic lines (Si I, Ti I, Fe I) used in our analysis in this region are marked by the dashed lines. Bottom panel: similar to the top panel, but for the turn-off stars in our sample; Y535, Y1388, and Y2235 are plotted in black, blue, and red, respectively.
Current usage metrics show cumulative count of Article Views (full-text article views including HTML views, PDF and ePub downloads, according to the available data) and Abstracts Views on Vision4Press platform.
Data correspond to usage on the plateform after 2015. The current usage metrics is available 48-96 hours after online publication and is updated daily on week days.
Initial download of the metrics may take a while.