Fig. 9.
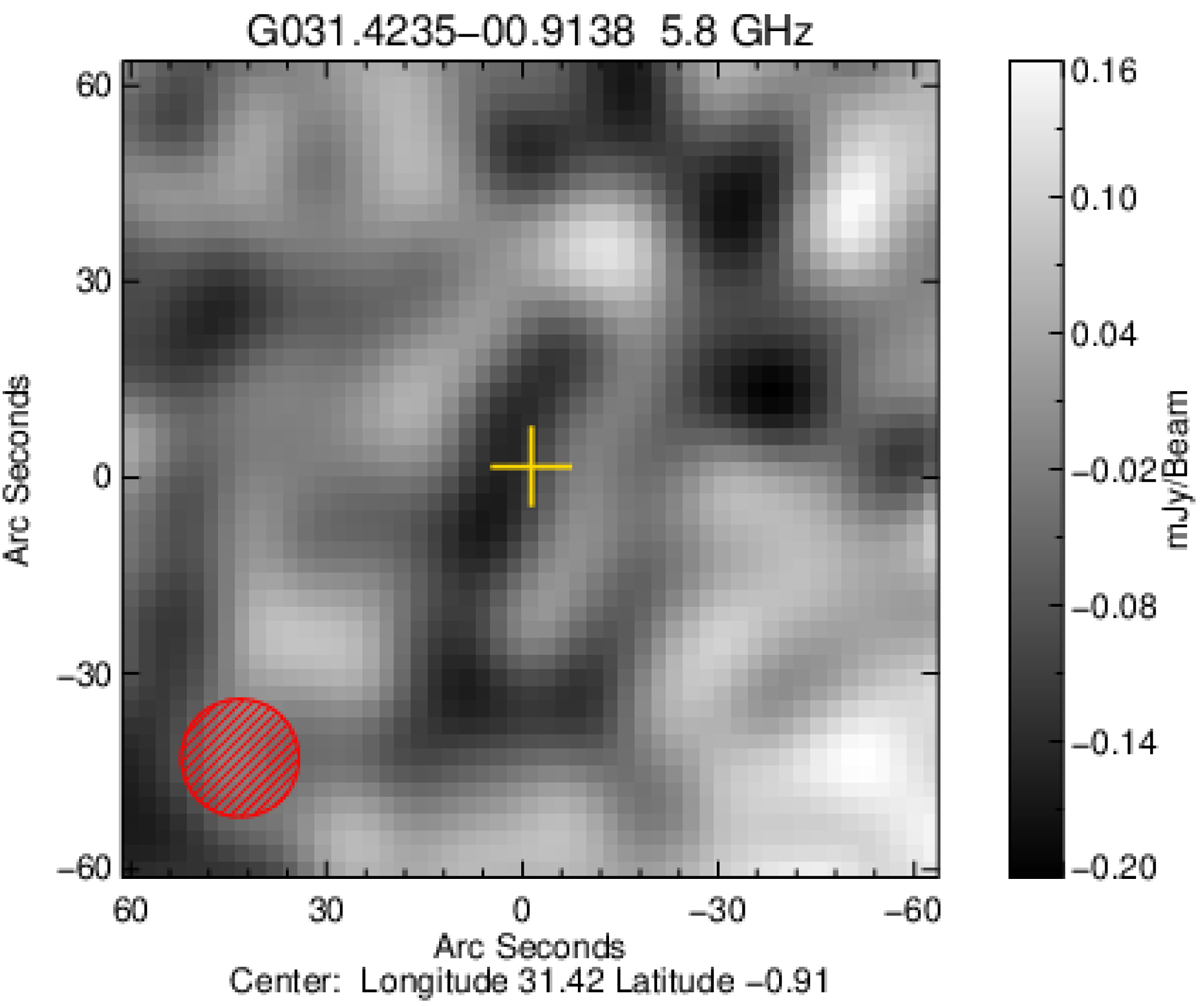
Example of a CORNISH source not detected in GLOSTAR. The grayscale is the GLOSTAR map of a 2′ × 2′ region centered on the position of the CORNISH source G031.4235−00.9138 (as indicated by the yellow cross). The noise towards this source is 63 μJy beam−1 and given that the integrated CORNISH flux is 3.47 mJy, it should have been easily detected in the GLOSTAR map. The red hatched circle shown in the lower left corner indicated the size of the GLOSTAR beam.
Current usage metrics show cumulative count of Article Views (full-text article views including HTML views, PDF and ePub downloads, according to the available data) and Abstracts Views on Vision4Press platform.
Data correspond to usage on the plateform after 2015. The current usage metrics is available 48-96 hours after online publication and is updated daily on week days.
Initial download of the metrics may take a while.