Fig. 7.
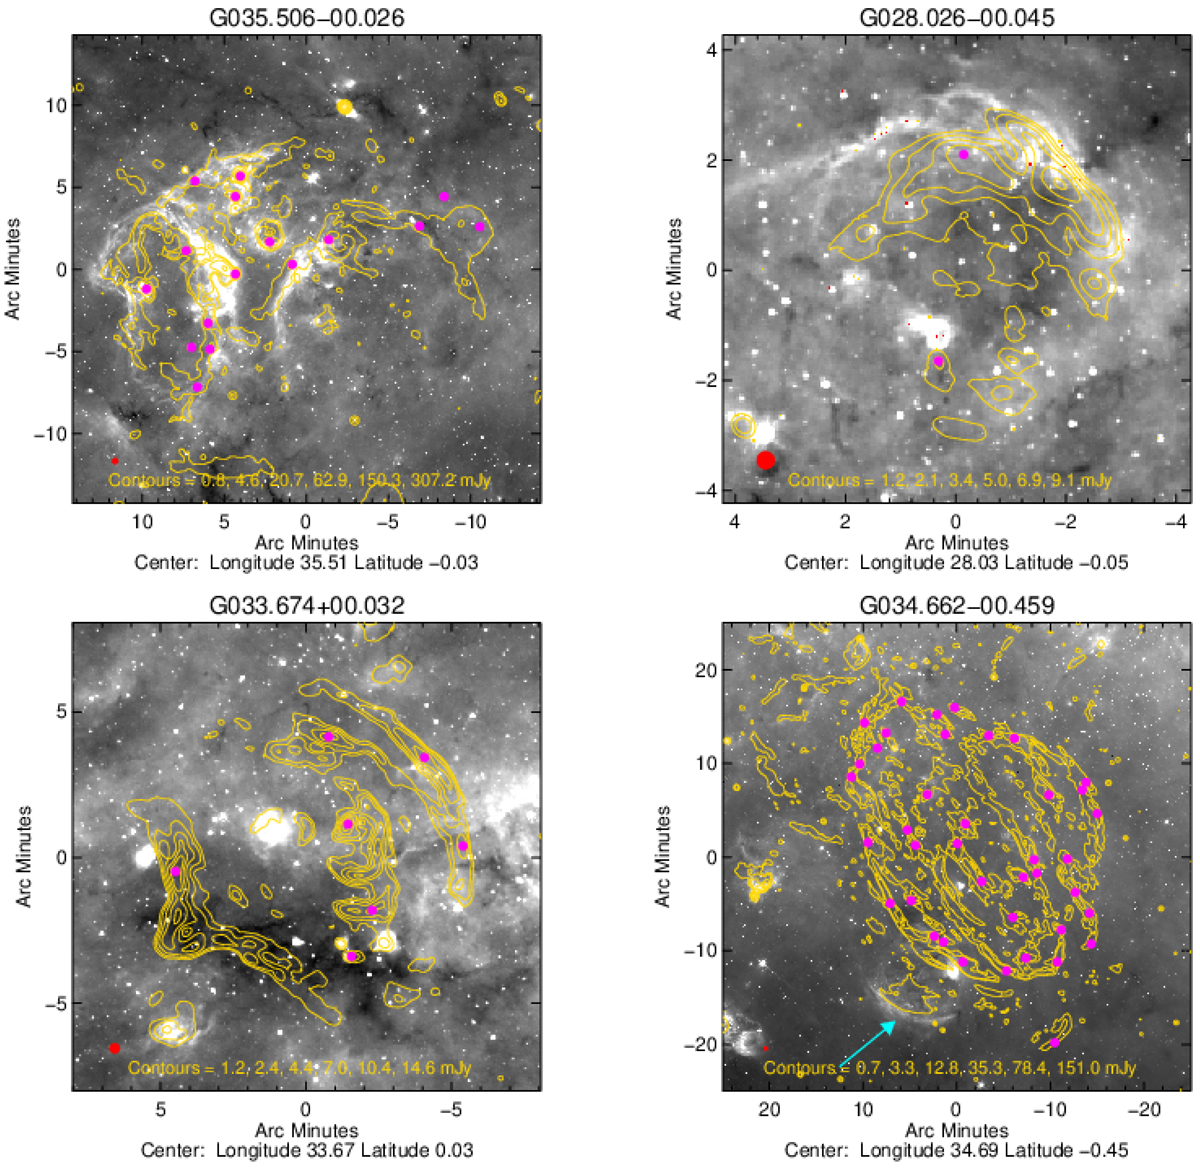
Example of radio emission associated with large scale structures. The background images are GLIMPSE 8 μm while the yellow contours are the GLOSTAR 5.8 GHz radio continuum emission. These regions often show coherent infrared structures that are morphologically correlated with most of the radio emission (see examples presented in the upper panels), however, the correlation is not always present but the radio emission is clearly correlated (see examples presented in the lower panels). These large scale structures have been excluded from the final catalog of radio sources. The contours are determined as described in Fig. 5 and the red filled circle shown in the lower left corners shows the GLOSTAR beam. The magenta circles indicate the peak positions of radio sources associated with these regions. Lower-right panel: W44 SNR; the cyan arrow points to the H II region (G034.793−00.711) located close to the edge of this complex (see text for details).
Current usage metrics show cumulative count of Article Views (full-text article views including HTML views, PDF and ePub downloads, according to the available data) and Abstracts Views on Vision4Press platform.
Data correspond to usage on the plateform after 2015. The current usage metrics is available 48-96 hours after online publication and is updated daily on week days.
Initial download of the metrics may take a while.